Wrike
Wrike header logoWrike header logo
    • For teams

      • Marketing

        Streamline proofing and reporting for seamless campaigns.

      • Creative & Design

        Create high-quality assets and get them approved in record time.

      • Product

        Accelerate your product process, from idea to delivery.

      • Client Services

        Exceed clients’ expectations with expert resources.

      • PMO

        Align strategy with execution and deliver results.

      • IT

        Execute initiatives, optimize workflows, and automate requests.

      • Operations

        Make work flow seamlessly with intuitive management tools.

      • HR

        Manage teams effortlessly with customizable HR features.

      • Legal

        Organize every file, case, and due date in one secure space.

      • Finance

        Centralize all financial tasks, from budgeting to invoicing.

      • See all teams

    • For industries

      • Technology

        Build solutions that matter, and deliver faster.

      • Consumer Goods

        Move fast with unified planning, delivery, and reporting.

      • Manufacturing

        Enhance operations, accelerate production, and empower teams.

      • Professional Services

        Organize clients, streamline projects, and automate workflows.

      • Finance

        Deliver better, faster financials with automations.

      • Healthcare

        Collaborate cross-functionally in a secure setting.

      • Education

        Unite multiple disparate teams, departments, and colleges.

      • Construction

        Streamline building projects, from scoping to invoicing.

      • Media & Entertainment

        Choose one powerful platform for fast-paced work.

      • Agencies

        Centralize client work, boost creativity, and increase profitability.

      • See all industries

    • Workflows

      • Campaign Management

        Make marketing magic with end-to-end campaign management.

      • Product Lifecycle

        Watch your product lifecycle flow, from concept to customer.

      • Client Service Delivery

        Get ahead of the competition with faster client services.

      • Project Management

        Plan Agile projects, track deadlines, and deliver results.

      • Project Portfolio Management

        Manage your complete portfolio, from strategy to results.

      • Creative Production & Content

        Create, collaborate, proof, and approve all in one place.

      • Resource Management

        View team workloads and reallocate tasks to avoid burnout.

      • Workflow Management

        Use custom statuses and automate your team workflows.

      • Event Management

        Design, execute, and monitor flawless events.

      • Task Management

        Organize incoming requests and eliminate repetitive tasks.

      • See all workflows

    • Explore Wrike

      • Take a Product Tour

      • Book a Demo

      • ROI Calculator

      • Customer Stories

      • Start with Templates

    • Features

      • Dashboards

        Fuel better, faster, data-driven decisions with powerful analytics.

      • AI

        Learn about powerful AI and automations with Work Intelligence®.

      • Automation

        Define and trigger automated workflows to eliminate manual efforts.

      • Gantt Charts

        Interactive project scheduling across teams.

      • Proofing

        Streamlined proofing and collaboration in one place.

      • Custom Item Types

        Tailor work items to fit your specific workplace.

      • Project Resource Planning

        Plan and allocate resources for timely delivery.

      • Project Views

        Get the full picture with customizable, intuitive project views.

      • Kanban Boards

        Instantly view project progress and create customized workflows.

      • Dynamic Request Forms

        Custom forms powered by conditional logic.

      • Approvals

        Keep approvers in the loop from start to finish.

      • Cross-Tagging

        Unparalleled visibility across multiple work streams.

      • See all features

    • Platform

      • New! Visual collaboration

      • Book a Demo

      • Start with Templates

      • Wrike AI

      • Integrations

      • Security

      • Mobile & Desktop Apps

    • Workflow-Powered Collaboration

      Sync with multiple teams to keep work flowing across your organization.

    • Industry-Leading Security

      We're dedicated to safeguarding data beyond industry standards and ensuring secure collaboration.

    • Pioneering AI and Innovation

      Put the power of data and AI to work for your organization.

    • Invested in Customer Success

      We support customers at every step of their journey from pre-sales to onboarding with 24/7 support.

    • Boundless Configuration

      Customize your workspace to suit the unique needs of every team in your organization.

    • Effortless Scalability

      Add new teams or adjust to rapid growth seamlessly with Wrike’s scalable platform.

    Why Wrike beats the competition

    Find out why 20,000+ of the world’s top companies choose Wrike to manage their workflows

    View comparison
    • Go deeper

      • Resource Hub

        Top assets on productivity, collaboration, and more.

      • Wrike Blog

        Latest news and best practices on project management.

      • Educational Guides

        Guides and tools to unlock better work management.

      • Webinars

        Join our live or on-demand sessions to do your best work.

      • Customer Stories

        Explore Wrike’s case studies for key insights on customer success.

      • Developers

        Connect and build integrations with easy-to-use APIs.

    • Upskill and Connect

      • Training & Certifications

      • Help Center

      • Wrike's Community

      • Premium Support Packages

      • Wrike Professional Services

      • Partners

    Introducing Wrike + Klaxoon

    You can now add Klaxoon’s infinite whiteboard to your Wrike subscription and work management toolkit

    Request a demo
  • Enterprise
  • Pricing
Contact Sales
    language-selector
    English
    Dansk
    Deutsch
    Español
    Français
    Bahasa Indonesia
    Italiano
    Bahasa Melayu
    Nederlands
    Norsk
    Polski
    Português (BR)
    Svenska
    Русский
    日本語
    한국어
    中文 (简体)
    中文 (繁體)
Log in
Wrike header logoWrike header logo
Menu
Guide overview
  • 1. Project Management Basics
  • 2. Project Management Methodologies
  • 3. Project Management Life Cycle
  • 4. Best Project Management Software
  • 5. Team Collaboration Tips
  • 6. Agile Methodology Basics
  • 7. Agile Project Management Tools
  • 8. Project Management Frameworks
  • 9. Resources
  • 10. Glossary
  • 11. FAQ
    • Advanced Terminology
    • Methodologies
    • PM Software Features
    • Basic Terminology
    • PMI
    • Professional Development
    • Tools
    • Agile Project Management
  1. Project Management Guide
  2. FAQ
  3. Advanced Terminology

What Is a Network Diagram in Project Management?

10 min read
Artem Gurnov
Artem Gurnov Director of Account Development, Wrike
See Wrike for PMO

What is a network diagram in project management?

Whether you’re a project manager or a project team member, you should familiarize yourself with network diagrams — also known as the project schedule network diagram. A project network diagram is an important tool because it helps teams visualize the activities that need to be completed over the duration of a project. It also gives crucial context like task duration, sequence, and dependency.

A network diagram is a visual map that illustrates a project’s scope by displaying activities as boxes or nodes, and the dependencies between these activities as arrows. This structured layout helps clarify the connection between the various tasks required to complete the project.

In this article, we’ll cover the following:

  • The concept of network diagrams in project management
  • The different types of project network diagrams
  • How network diagrams integrate with project management software

Need a comprehensive solution to manage your project phases beyond simple diagrams? Consider using Wrike. Our platform provides robust project management features — including Gantt charts and Kanban boards — needed to enhance project execution.

What is a project network?

A project network is a graph that shows the activities, duration, and interdependencies of tasks within your project.

What is a project schedule network diagram in project management?

A project schedule network diagram visualizes the sequential and logical relationship between tasks in a project setting. This visualization relies on the clear expression of the chronology of tasks and events.

Most often, a project network diagram is depicted as a chart with a series of boxes and arrows. This network diagram tool is used to map out the schedule and work sequence for the project, as well as track its progress through each stage — up to and including completion. Because it encompasses the large tasks that need to occur over the project’s duration, a network diagram is also useful in illustrating the scope of the project.

Now, imagine turning those diagrams into a dynamic schedule where you can see everything on a timeline. With Wrike, you can easily use Gantt charts to see the big picture and drill down into details like critical paths, task durations, and deadlines. You can also punctuate your timeline with clear milestones, making it easier to assess progress at a glance. Gantt charts make coordinating with your team easy, ensuring everyone knows what to do and when. Plus, linking tasks helps avoid any hold-ups that could throw a wrench into your workflow.

Benefits of the project management network diagram

A network diagram allows a project manager to track each element of a project and quickly share its status with others. Its other benefits include:

  • Visual representation of progress for stakeholders
  • Establishing project workflows
  • Tracking dependencies and potential bottlenecks

For instance, according to Wrike’s 2023 Efficiency Report — team leaders typically see only about 55% of the work their teams perform, while business leaders have visibility into roughly 58% of their team’s efforts. This gap means that approximately 42-45% of work often remains unmonitored or “invisible,” leading to inefficiencies and miscommunication.


Blog Image What Is Network Diagram In Project Management Page 1Blog Image What Is Network Diagram In Project Management Page 1

Incorporating network diagrams into your project management strategy can provide a more complete view of all project activities, thereby improving performance across the board.

Video preview

Video transcription

"Precedence diagram method. I know, I know, it sounds kind of complicated, but I've got your back. I'm going to explain the precedence diagram method in the simplest terms possible.

You ready? Okay, here we go. Let's start with what a precedence diagram method is. The precedence diagram method, or PDM, helps project managers define a clear and proper sequence of project tasks and activities in a visual format.

PDM helps project managers highlight paths, relationships, and dependencies between activities to ensure a successful project delivery. Since it's a visual representation of a project's priorities, a precedence diagram helps teams visualize the priorities and assignments at a glance. It can help project managers see missing activities and get an accurate project schedule.

You're probably thinking, that sounds really useful, but how am I supposed to put one together? Well, stick with me, and we'll cover that now. As a project manager, first, you need to gather details of project activities, durations, and dates. Those are the building blocks for your precedence diagram.

Then, you need to identify activities with a critical path from the start of your project to its finish. Using those critical paths, you'll connect any dependencies and find the optimal workflow for your project. Once you have all of that information organized, you're ready for the diagram portion of your program.

You're going to draw a simple picture of your project sequence, connecting the activities in a precedence diagram. There are four ways to illustrate a precedence diagram. Those form the connection between the activities inside your precedence diagram.

Finish to start. In this case, task B cannot start until task A has been completed. Start to start.

Here, task B cannot start until task A starts. Finish to finish. With this one, task B cannot be completed until task A is completed.

Start to finish. Lastly, task B cannot be completed until task A starts. You might have a project where none of these activities connect this way, but most projects typically fall under one of those four sequences.

How does one draw a precedence diagram like the one we showed you? Well, Wrike can help you with all the prep work for your precedence diagram, so you can make sure it's accurate and effective. Wrike organizes project plans and schedules to help you draw precedence diagrams quickly. First, you'll define the task needed to complete your project.

Then, you'll check each task for dependencies, assign due dates, and set durations. Once your data is all organized, you can use a website like diagrams.net or eDraw to help you create the perfect diagram. Then, all you have to do is bask in the wonder of having a precedence diagram to help you keep track of your project."

Types of project network diagrams: Arrow diagram and precedence diagram

There are two main types of network diagrams in project management: the arrow diagramming method (ADM), also known as “activity network diagram” or “activity on arrow”; and the precedence diagramming method (PDM), also known as “node network” or “activity on node.”

Arrow diagram method (ADM)

The ADM, or activity network diagram, uses arrows to represent activities associated with the project. It’s important to note that, due to the ADM’s limitations, it is no longer widely used in project management. However, it’s still useful to understand ADMs, so that you can recognize these diagrams if they arise in your work environment.

In ADM:

  • The tail of the arrow represents the start of the activity and the head represents the finish.
  • The length of the arrow typically denotes the duration of the activity.
  • Each arrow connects two boxes, known as “nodes.” The nodes are used to represent the start or end of an activity in a sequence. The starting node of an activity is sometimes called the “i-node,” with the final node of a sequence sometimes called the “j-node.”
  • The only relationship between the nodes and activity that an ADM chart can represent is “finish to start” or FS.

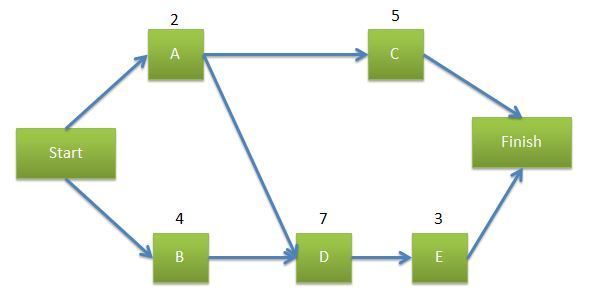
Occasionally, “dummy activities” — arrows that do not represent a direct relationship — need to be included in ADM network diagrams. In the diagram below, activity C can only occur once activities A and B are complete; in the network diagram, you’ve connected activity A to activity C. Perhaps we’re talking about tiling a floor (activity C): It can only begin once the concrete is poured (activity A) and the permits are obtained (activity B). Since activities A and B are not directly related — A doesn’t lead to B, and B doesn’t lead to A — you’ll need to draw a dummy activity between B and C to show that C is dependent on B being completed. An ADM chart also does not have a way to encapsulate lead and lag times without introducing new nodes and activities.

Project Schedule Network Diagram

Precedence diagram method (PDM)

PDM network diagrams are frequently used in project management today and are a more efficient alternative to ADMs. In the precedence diagramming method for creating network diagrams, each box, or node, represents an activity — with the arrows representing relationships between the different activities. The arrows can therefore represent all four possible relationships:

  • “Finish to start” (FS): When an activity cannot start before another activity finishes
  • “Start to start” (SS): When two activities are able to start simultaneously
  • “Finish to finish” (FF): When two tasks need to finish together
  • “Start to finish” (SF): This is an uncommon dependency and only used when one activity cannot finish until another activity starts


Blog Image What Is Network Diagram In Project Management Page 2Blog Image What Is Network Diagram In Project Management Page 2

In PDM, lead times and lag times can be written alongside the arrows. If a particular activity is going to require 10 days to elapse until the next activity can occur, for example, you can simply write “10 days” over the arrow representing the relationship between the connected nodes.


Bring the elements of your network diagram to life in Wrike

In project management, a well-structured network diagram lays the groundwork for efficient project planning and execution, ensuring all team members know their roles and the timelines involved.

Integrating a tool like Wrike into managing a network diagram can significantly enhance its effectiveness. For example, Wrike offers tailored templates that can be used directly in your project planning. These include our:

  • Work breakdown structure template, which helps in detailed task delineation
  • Complex project with phases template for managing multistage projects
  • Project schedule template to keep timelines clear
  • Project performance template for monitoring ongoing progress

And that’s not all. As mentioned, you can use Gantt charts to visually map out the critical path, assign tasks, set durations, add milestones, and define due dates. This ensures every task is clearly plotted and dependencies are easily managed, helping you eliminate bottlenecks and keep the project flowing smoothly. Similarly, you can use Wrike’s Kanban boards to track tasks through different stages of completion. This visual approach clarifies the status of each task, providing a real-time overview of multiproject progress to avoid any miscommunication.

Ready to breathe new life into your network diagrams? Start your free trial of Wrike today.


Further reading:

Blog Post

3 Ways To Create Your Project Manager Calendar

Blog Post

Critical Path Method in Project Management is as Easy as 1,2,3

Project Management Guide

What Is PERT in Project Management?

Blog Post

5 Most Common Mistakes in Managing Multiple Projects: Project Schedules 

Advanced Terminology 5 questions
What Is Change Management in Project Management? What Is Cost-Benefit Analysis in Project Management? What is Cost Control in Project Management? What is Cost Management in Project Management? What is Cost Variance in Project Management?
Artem Gurnov

Artem is a Director of Account Development at Wrike. He previously held the role of Project Manager, overseeing a team of customer success managers (CSMs). Over the years of building teams and scaling business processes, he has successfully deployed multiple projects, from automating client outreach to setting up work prioritization tools for sales reps and CSMs.

#project management #network diagram #arrow diagram method #adm #precedence diagram method #pdm
Basic Project Management
  • Project Charter
  • Project Management Stakeholders
  • What is a Project?
  • Work Breakdown Structure
  • Project Objectives
  • Project Baseline
  • Project Management Scheduling
  • Project Management Work Packages
  • Project Management Scope
  • Scope Creep
Advanced Project Management
  • What is PERT?
  • S-Curve
  • Network Diagram
  • SMART
  • Risk Management
  • Cost Estimation
  • Feasibility Study
  • Monte Carlo Analysis
  • Project Integration
  • Cost Management
PMI
  • Milestones
  • PDU
  • PMI Project Management
  • What To Do With Certification
  • Certification
  • Become Certified
  • PMP Certification
  • Best Certification
Software Features
  • Critical Success Factors
  • Capacity Planning
  • User Role Access Permissions
  • Time Tracking
  • Budget Tracking
  • Request Forms
  • Work Assignments
  • Version Control
  • Dependency Managements
  • Project management Milestones
Tools
  • Project Management Software
  • Project Management Tools
  • Project Management System
  • Gantt Charts
  • Product
    • Product tour
    • Pricing
    • Templates
    • Apps & Integrations
    • Task Management
    • Gantt Charts
    • Wrike Status
    • Security
    • Wrike API
    • Compare
    • Features
  • Solutions
    • Enterprise
    • Marketing
    • Creative
    • Project Management
    • Product Development
    • Business Operations
    • Professional Services
    • IT Management
    • Students
    • All Teams
    • All Use Cases
  • Resources
    • Help Center
    • Community
    • Blog
    • Webinars
    • Interactive Training
    • Support Packages
    • Find a Reseller
    • Google Project Management Tools
    • CA Notice at Collection
  • Company
    • About Us
    • Leadership
    • Careers
    • Our Customers
    • Events
    • Newsroom
    • Partner Program
    • Collaborate - User Conference
    • Wrike Engineering
    • Contact Us
  • Guides
    • Project Management Guide
    • Professional Services Guide
    • Kanban Guide
    • Agile Guide
    • Remote Work Guide
    • Scrum Guide
    • Marketing Project Management Guide
    • Collaborative Work Management Guide
    • Digital Marketing Guide
    • Return to Work Guide
    • Product Management Guide
    • Go-to-Market Guide
    • Goal Setting Guide
  • Latest in Wrike Blog
    • Free Google Sheets budget template (Excel included)
    • How to create and manage a project calendar to deliver projects on time
    • Work breakdown structure template (WBS) for project management
    • Project organization: Your ultimate guide
    • How to write a business requirements document (Plus template)
    • Stay productive anywhere: A deep dive into the Wrike mobile app
    • From good to game changing: The power play of human instinct + AI speed in 2025

Subscribe to Wrike news and updates

Stay informed with the latest news and updates by subscribing to our marketing emails.

  • App Store
  • Google Play
©2006-2025 Wrike, Inc. All rights reserved. Patented. Privacy Policy. Terms of Service. Cookie Preferences