
What is a Gantt chart in project management?

The seven key elements of a Gantt chart are the task list, time scale, task bars, dependencies, milestones, progress indicators, and assigned owners or resources. Together, these components create a complete visual timeline that shows what needs to be done, when it will happen, and who is responsible for the work.
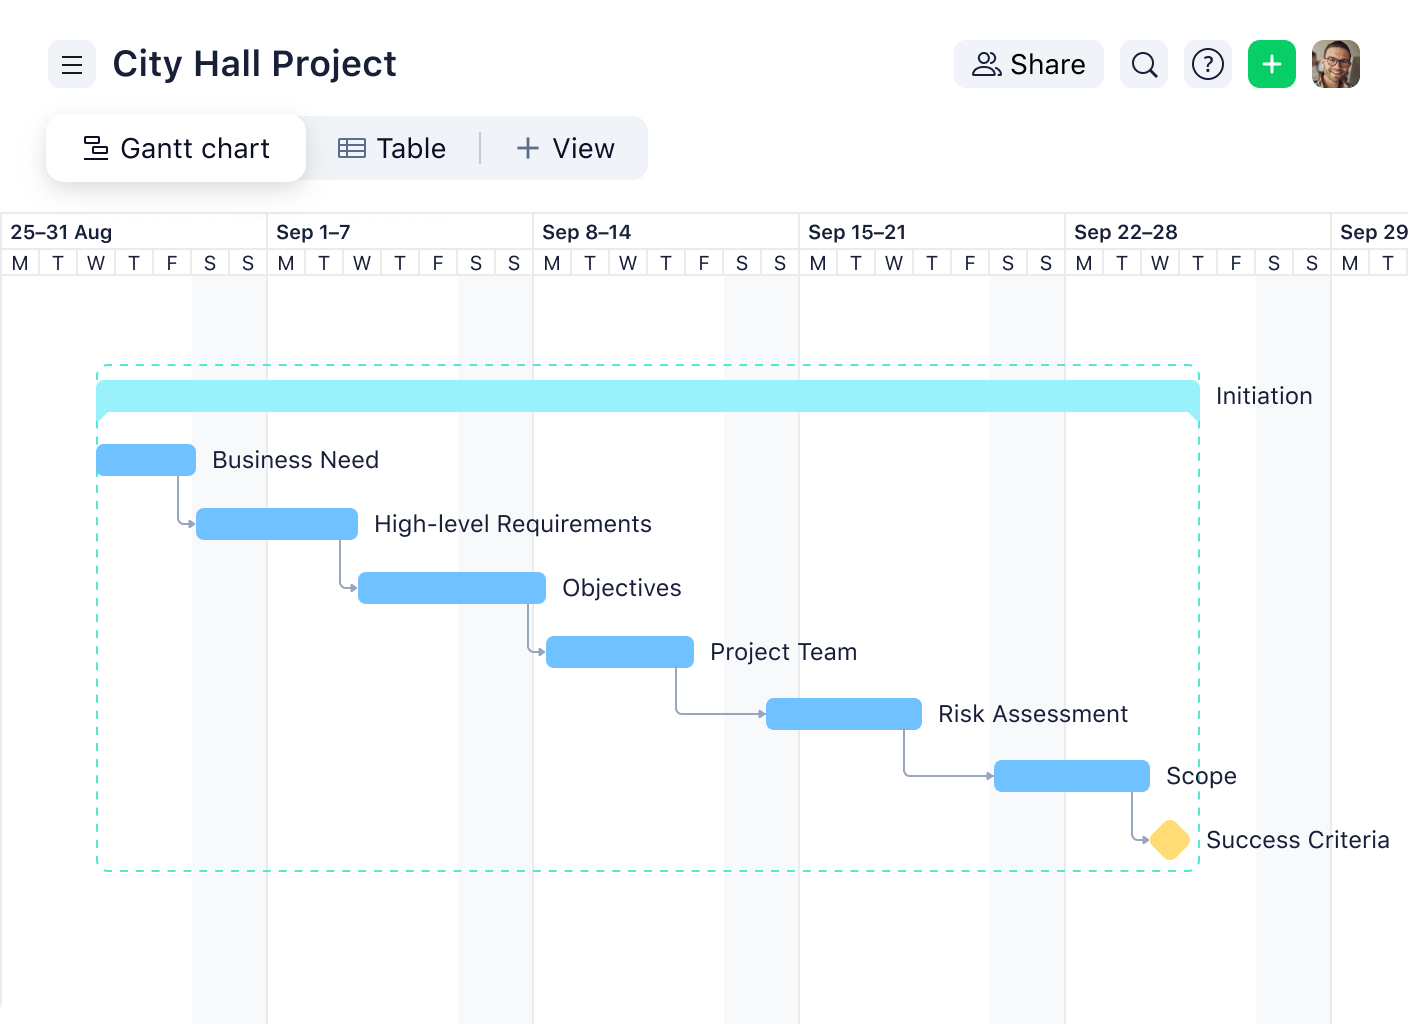
A Gantt chart is used to plan, visualize, and track project schedules. It helps teams understand task durations, identify dependencies, monitor progress, and coordinate work across contributors. Project managers rely on Gantt charts to ensure that milestones are met and the overall project stays on track.
To make a Gantt chart in Wrike, create a project, add your tasks, and assign start and end dates. Wrike automatically generates a dynamic timeline where you can adjust task bars, add dependencies by dragging connectors, convert tasks into milestones, and monitor real-time progress. Any task updates made in Wrike instantly sync across your Gantt chart, dashboards, and workload views.
Advantages
- Provide a clear visual timeline for the entire project
- Highlight task dependencies and sequencing
- Improve team alignment and shared understanding
- Reveal scheduling risks and potential bottlenecks
- Help track progress across phases or teams
- Particularly useful for multi-phase or cross-functional projects
Disadvantages (reduced with modern Gantt chart software)
- Can be difficult to maintain for very large or complex projects
- Static templates require frequent manual updates
- Often lack real-time collaboration features
- May become overwhelming when overloaded with details
A strong Gantt chart tool should offer automated scheduling updates, task dependencies, milestone tracking, drag-and-drop editing, collaboration features, and real-time progress visibility. Integration with other project views — such as tables, boards, or workload management — is also essential. Platforms like Wrike combine these capabilities into a single, connected workspace.
Gantt charts are primarily used in the project schedule section of a project management plan. This is where teams define task timelines, sequence work, identify dependencies, and map out the critical path. The schedule becomes the roadmap that guides execution, monitoring, and reporting throughout the project lifecycle.
Lead time refers to the amount of time a successor task can begin before its predecessor task is fully complete. In a Gantt chart, lead time shortens the interval between dependent tasks, allowing parallel work and helping accelerate timelines when appropriate. It’s the opposite of lag time, which introduces delays between tasks.