- A project management dashboard is a real-time visual tool that gives managers and leadership an at-a-glance view of task progress, resource allocation, and upcoming project milestones.
- The most useful project management dashboards combine task completion rate, budget vs actual spend, resource utilization, project timeline adherence, and risk indicators in a single view.
- Building a project management dashboard in Tableau means preparing clean project data, connecting it to Tableau, building each metric as an individual view, and arranging those views with dashboard filters for project, date, and status.
- Tableau dashboards reflect data only as fresh as the last manual export, and they cannot assign tasks, trigger notifications, or capture comments, which is where dedicated project management tools take over.
- Wrike’s dashboards refresh in real time and live alongside the work itself, so the same platform that captures tasks, deadlines, and status changes produces the visibility leadership needs without a separate reporting layer.
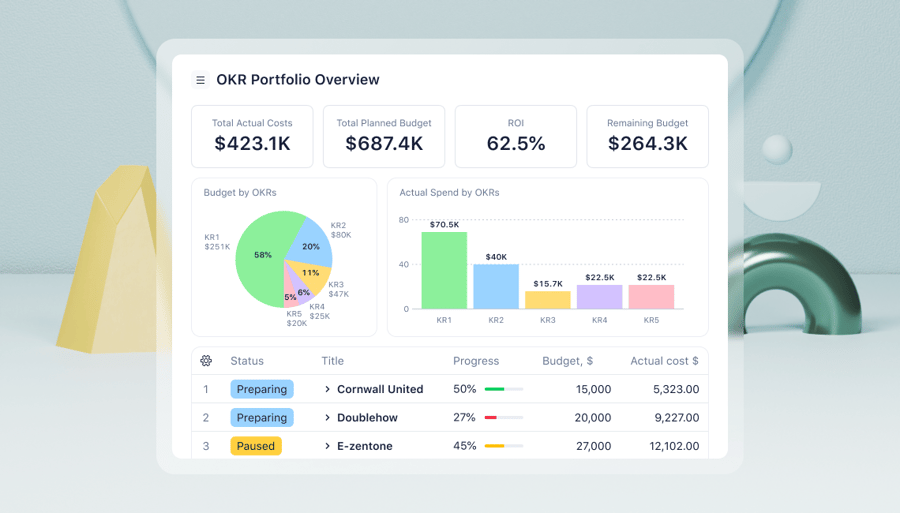
Leadership teams usually don’t need more project data; they need the data they already have in a format they can act on. When task names, owners, due dates, and budget figures are buried in a spreadsheet with hundreds of rows, nobody reads it. A project management dashboard turns that same data into a clear, decision-ready view of what’s on track, what’s at risk, and where the budget stands.
When it’s time to build a project management dashboard like this, Tableau is the natural choice because it’s the BI tool most enterprise teams already use. The challenge is knowing which data to connect, which project metrics belong in the view, and how to structure the layout so it answers the questions leadership keeps asking.
This article walks through:
- What a project management dashboard should include
- How to build one in Tableau step by step
- Where the Tableau approach hits its limits
- When a dedicated project management dashboard is the better fit
Wrike’s project dashboards update in real time alongside your task and project data, so you skip the manual exports and rebuild cycles. Start a free trial or book a demo to see them in action.
What is a project management dashboard?
A project management dashboard is a visual display of the key metrics, status indicators, and progress data a manager needs to track one or more projects in real time. At the most basic level, it pulls task-level data into a single view that shows project health at a glance.
A well-built dashboard surfaces:
- Task completion rates
- Milestone progress
- Budget tracking against approved spend
- Resource allocation across the team
- Timeline adherence
- Risk indicators for overdue tasks or at-risk dependencies
- Any other factors relevant to a specific project, team, or industry
The point is to keep everything a stakeholder needs to assess project status in one place rather than leaving it scattered across task lists, Microsoft Excel, and weekly status emails.
Project management dashboards are used by project managers, PMOs, and leadership teams to monitor projects without manually pulling reports each week. Project managers use them to spot slippage early, PMOs for portfolio management across a company’s initiatives, and leadership teams to know which projects are on track and which need attention before the next meeting.
What should a project management dashboard include?
Many project management dashboards look impressive, but don’t provide the information that managers actually need. The key performance metrics below consistently earn their place on a project dashboard because they genuinely help inform management decisions throughout the project lifecycle.
- Task completion rate: This metric shows whether work is being completed at the pace the project timeline assumes. If 30% of tasks are complete at the halfway point of the project, you have an early signal of slippage worth investigating before it becomes a larger problem.
- Milestone progress: Milestones are the load-bearing points of a project plan. A missed or at-risk milestone usually signals that the dependencies behind it are slipping, which is the kind of warning leadership wants to see before deadlines start to shift back.
- Budget vs actual spend: These dashboard widgets, based on current spends, billable hours, etc., show how much has been spent against the approved project budget at any given point. They can help managers catch a budget overrun while there’s still room to course-correct.
- Resource utilization: By tracking how team members’ time is allocated across tasks, dashboards can surface overallocation that leads to burnout and underutilization that wastes capacity.
- Timeline adherence: Dashboards should also show how many tasks are landing on schedule, how many are delayed, and by how much. The “how much” is what tells leadership whether the project needs a small adjustment or a serious intervention.
- Risk and blocker indicators: Most project delays come from blockers that were visible weeks before. By monitoring issues like overdue tasks and at-risk dependencies, managers can take early action.
- Open vs closed issues: Here, dashboards should count the issues raised, resolved, and still open across the project. The ratio of opened to closed tells you whether the team is gaining or losing ground week over week, which is especially useful for sprint-based, Agile projects.
- Team workload distribution: These metrics show how work is spread across team members. It’s critical to plan capacity before the next phase begins and to identify patterns in which one or two people are carrying a disproportionate load.
How to build a project management dashboard in Tableau step by step
It’s possible to build a project management dashboard in Tableau that displays all these metrics in six sequential steps. All you have to do is remember that each step stacks on the previous stage: Clean data feeds the right charts, the right charts make the dashboard useful, and the right filters make the dashboard actionable for whoever is reading it. If a step is skipped early on, there’s a high chance you’ll have problems with your final dashboard.
Step 1: Prepare your project data source
Before opening Tableau, the data itself needs to be in the right shape.
Project data typically comes from a spreadsheet with task-level rows, a database export from your project management tool, or a direct connector to platforms like Jira or Asana. Whichever source you use, the data should include:
- Task name
- Assigned owner
- Start date
- Due date
- Completion status
- Project or workstream
- Budget data (if you’re tracking spend)
Before connecting anything, it’s important to clean the source. This means removing blank rows, unmerging cells, standardizing column headers, and ensuring dates are in a single, recognizable format.
What this looks like in practice: A PMO analyst exports task data from Asana into a Google Sheet, deletes the blank header rows from the export, standardizes the column headers into a single row with consistent naming, confirms every “Due Date” cell is in YYYY-MM-DD format, and saves the result as a clean CSV before opening Tableau.
Step 2: Connect your data source to Tableau
Open Tableau Desktop or Tableau Public and use the Connect pane to select your data source type, whether that’s Excel, Google Sheets, CSV, or a database connector.
When the data loads, check that Tableau has correctly identified each field’s type: Date columns should show as dates, numeric columns as numbers, text fields as text. Tableau guesses based on the first few rows and often gets it wrong, so it’s worth a manual check. If your project data spans more than one sheet (say, tasks in one and budget data in another), use Tableau’s join functions to combine them before building views.
What this looks like in practice: A project manager connects a Google Sheet with 300 rows of task data to Tableau, opens the data preview, notices the “Due Date” column has been imported as a string rather than a date, manually changes the field type to date, and confirms the dataset previews correctly before moving on.
Step 3: Define the key metrics and build individual charts
Before opening the dashboard canvas, build each metric as its own Tableau sheet. This makes arranging and filtering them later far easier than constructing everything inside the dashboard view itself.
You can build a task completion bar chart with Status in the columns and Task Name in the rows, or a milestone timeline as a Gantt chart with Due Date in the columns and Milestones in the rows. A budget vs. actual chart shows a side-by-side comparison of budget and actual spend by workstream. Team workload is typically displayed as a bar chart, with the Owner in the rows and the count of open tasks in the columns.
What this looks like in practice: The PMO creates four separate sheets before opening the dashboard canvas: task completion by project, milestone dates vs actual completion, budget burn by workstream, and tasks by assigned owner. Each sheet is named clearly, so it’s easy to identify when dragging it into the dashboard later.
Step 4: Build the dashboard layout
Create a new dashboard sheet in Tableau and drag your individual views from the left panel onto the canvas.
Set the dashboard size first. Fixed size is more predictable for sharing, while automatic adapts to the viewer’s screen. Arrange views in a logical reading order, with summary metrics at the top, detail charts below, and less critical data toward the bottom. Group related charts together (timeline and milestones, budget and workload), and leave white space between them. A crowded dashboard is harder to read than a focused one.
What this looks like in practice: The PMO places a task completion summary at the top left, a milestone Gantt chart spanning the full width below it, and two smaller charts (budget burn and team workload) sitting side by side at the bottom. The whole layout fits on a single screen with no scrolling required.
Step 5: Add filters for interactivity
A useful project management dashboard lets the viewer slice the data by project, date range, team member, or status.
In Tableau, you can add filters by dragging dimensions onto the filters shelf, then right-clicking the filter and selecting “Apply to Worksheets.” Then, “All Using This Data Source” makes it global across the dashboard. Add a date-range filter for time slicing, a project-name dropdown for switching between active projects, and a status filter with options such as “On Track,” “At Risk,” and “Delayed.” Position filters along the top or right side of the dashboard so they’re easy to find.
What this looks like in practice: The VP of Engineering opens the dashboard, uses the project name dropdown to switch between three active product launches, and applies the date filter to see only the current sprint’s data. Without leaving the dashboard, they can compare status across all three launches in under a minute.
Step 6: Publish and share the dashboard
Once the dashboard is built, publish it to Tableau Server or Tableau Cloud so leadership can access it without Tableau Desktop.
Set up a scheduled data refresh — daily, hourly, or fifteen-minute intervals, depending on how live the data is — so the dashboard updates automatically. Share with a view-only link, or embed it inside Confluence or SharePoint for broader internal visibility.
It’s essential to remember that Tableau dashboards built on spreadsheets only refresh as often as the source data updates. If someone manually updates the spreadsheet each week, the dashboard is only as current as that manual refresh.
If you’re using Tableau Public rather than Tableau Cloud or Tableau Server, scheduled data refresh isn’t supported (automated refreshes are restricted exclusively to cloud-based Google Sheets sources), and dashboards are publicly visible by default. Private hosting and automated refresh require a paid Tableau license.
What this looks like in practice: The PMO publishes the dashboard to Tableau Cloud, sets a daily refresh at 7 a.m., and shares a view-only link with the leadership team. Every Friday morning, they still have to manually update the source spreadsheet before the 7 a.m. refresh runs. Otherwise, leadership sees data from the week before.
Limitations of building a project management dashboard in Tableau
While it’s possible to build a solid, informative project management dashboard in Tableau, it’s important to acknowledge its limitations.
Tableau is built as a business intelligence platform, and you can see that when it’s used for project management. While the platform handles visualization well, the active work of running projects (assigning tasks, capturing approvals, updating status) happens outside Tableau.
The limitations below reflect the mismatch between what Tableau is designed for and what project management often requires.
- Data is only as current as the last manual update. As we mentioned above, Tableau dashboards built on spreadsheets require manual data entry or exports to stay accurate. Unless the source is a live database or a direct connector, the dashboard shows the last time someone updated the file rather than the current state of the project.
- Tableau doesn’t manage tasks. Tableau shows project data but cannot assign tasks, set deadlines, or trigger notifications when something falls behind. It’s a reporting layer on top of work that happens somewhere else, which means anything that moves work forward has to happen in another tool.
- Approvals and workflow integration sit outside Tableau. Approval routing, review cycles, and project handoffs all happen in your project management tool or via email, then are reported on in Tableau after the fact. The dashboard can show that a milestone was approved, but the approval itself can’t be captured there.
- The data model is fragile to changes in the project. When projects evolve (new fields added, statuses renamed, workstreams restructured), the underlying data structure shifts, which can break existing Tableau calculations and chart configurations. Each restructure means rebuilding sections of the dashboard.
- Collaboration is one-directional. Tableau dashboards are designed for viewing rather than team interaction. Project stakeholders can see the data, but they can’t add comments, flag risks, or update task statuses directly in the dashboard. Discussion happens in Slack, email, or in the meeting the dashboard was supposed to replace.
- Setup and maintenance take time. A well-built Tableau project dashboard takes time to configure properly, especially when data is coming from multiple sources. That cost is recurring rather than one-time, since data structures change and refresh schedules need to be maintained as projects rotate in and out.
None of these limitations is a dealbreaker on its own. Together, though, they’re the reason teams maintaining Tableau project dashboards over time often look for a tool that combines the data and work layers rather than keeping them in separate systems.
How Wrike’s project management dashboards work
The limitations of tools like Tableau dashboards, template datasheets, and basic project management apps like Trello stem from the fact that they’re separate from the platform where your team does their work.
With Wrike’s powerful project management tools, you get everything you need to make informed decisions and manage your team effectively. Crucially, you can gather all those metrics in the same platform your team uses to plan, assign, and track their work.

Build your team’s perfect dashboard with Wrike
Wrike does what other project management dashboard solutions can’t do: it draws the latest data from all over your project and presents it in the way that best supports your work.
You can create unique project management overviews or personal spaces for every team member. Plus, Wrike’s enhanced, intelligent dashboards are completely customizable. However, you choose to configure them, they draw their information from the shared folders and workflows that form the central source of truth for your project.
Setting up Wrike can take some effort, but it’s worth it for the project control, flexibility, and scalability you get in return.
Here’s what the process looks like step by step:
- Create a new dashboard from your Wrike homepage. Open Wrike and click “Dashboards,” “Create Dashboards,” “+New Dashboard.” Name it, assign it to the relevant workspace (a team-specific dashboard or one accessible to the whole project), and click “Create.” Our Business plan supports unlimited dashboards, while Pinnacle adds advanced reporting for enterprise teams.
- Add prebuilt widgets to populate your dashboard. Widgets pull live data from your workspace and update automatically when tasks are marked “Complete,” “Resolved,” or “Ready for review.” Wrike includes preconfigured widgets for things like “My Tasks,” “My Tasks This Week,” “Starred Tasks,” “Pending File Reviews,” and “Activity Stream.” You can also build custom widgets to track KPIs such as overdue tasks, ticket status, conversion rates, new customers, and employee performance, using graphs, charts, or tables, depending on the visualization tool that best makes sense for the data. Every team member can also set up a personal dashboard with their own filters, giving them an individual view of the same central data source that shows them what needs their attention first.
- Share the dashboard with your team. Go to “Share” and type the name of anyone who needs access. There are three permission levels: Full (can rename or delete), Editor (can adjust widgets and filters), and Read Only (view-only). You can also generate a public link for external stakeholders and unshare or restrict visibility at any time to keep sensitive information, like project finances, limited to the right people.

By using Wrike’s dashboards to centralize and share their most important project management processes:
- The Texas Rangers execute massive campaigns, such as branding, over 1.2 million square feet at Globe Life Field.
- Siemens Smart Infrastructure delivers projects on a global scale, with 14,000 users across 20+ countries, monitoring 250 custom workflows to increase visibility and collaboration.
- Chosen Foods reduces process deviations by 20% and eliminates 4 hours of weekly meetings by using shared dashboards.
Wrike vs. Tableau
The table below compares how Tableau and Wrike handle the work of building and maintaining a project status dashboard.
Here, we evaluated the native feature sets of each platform as of June 2026, with the Tableau column reflecting Tableau Desktop and Tableau Cloud, and the Wrike column reflecting the current core product. The criteria focus on the capabilities that matter most when running a project dashboard over time: data freshness, task management, team collaboration, reporting depth, setup time, and ongoing maintenance burden.
|
Capability |
Tableau |
Wrike |
|
Data freshness |
Periodic. Manual or scheduled refresh from external sources; real-time only with a live database connection |
Real-time. Updates as work happens inside the platform |
|
Task management |
None. Visualization layer only — cannot assign tasks or trigger notifications |
Native. Tasks, assignments, due dates, dependencies, and status workflows are built in |
|
Collaboration |
View-only. Stakeholders can’t add comments, flag risks, or update status from the dashboard |
Interactive. Comments, @mentions, approvals, and status updates happen in the dashboard |
|
Reporting depth |
General-purpose. Wide range of chart types and custom calculations across any data source |
Project-focused. Dashboard templates for workload, Gantt, burndown, and custom reports |
|
Setup time |
Hours. A dashboard with four to six charts takes roughly four to eight hours for an intermediate user, plus data prep |
Minutes. Dashboards built from preconfigured widgets and templates |
|
Ongoing maintenance |
Recurring. Data structures, refresh schedules, and chart configurations need maintenance as projects evolve |
Minimal. Dashboards update automatically; no separate data layer to maintain |
For powerful, personalized project dashboards, try Wrike
When you work within Wrike, you can build detailed project planning dashboards that monitor every detail of your work. You can be sure your decision-making is based on the freshest data, and you can drill down into the information when you need to find out more.
Our platform includes dashboard components that cater to a wide range of project needs. From tracking progress on individual tasks to managing your entire project portfolio, Wrike’s dashboards are designed to help teams of all sizes. Plus, our intuitive interface and customizable layout make it easy to read and understand relevant metrics at a glance.
Wrike’s dashboard systems have benefits far beyond your management team. By displaying the latest updates on your shared tasks (and sending automated notifications when something changes), everyone on your team has a place to plan, prioritize, and collaborate on their work.
Book a demo today to find out how Wrike can empower your team.
Project management dashboard FAQs
Can Tableau be used for project management?
Yes, Tableau can be used for project management, but it works as a reporting layer rather than a work execution tool. You can build dashboards that visualize task completion, milestone progress, budget usage, and resource allocation. However, you’ll still need a separate tool to actually assign tasks, capture approvals, and update status. Tableau is best treated as the visualization layer on top of project data that lives elsewhere.
What data do I need to build a project management dashboard in Tableau?
At a minimum, you need task-level data, including task name, assigned owner, start date, due date, completion status, project or workstream, and budget data if you’re tracking spend. The data can come from a spreadsheet exported from your project management tool, a database export, or a direct connector to a platform like Jira or Asana. Whatever the source, the data needs to be clean: consistent column headers, ungrouped cells, and dates in a standard format.
What is the difference between a Tableau dashboard and a project management dashboard?
A Tableau dashboard is built by configuring views on top of project data exported from elsewhere, with the dashboard living in a BI tool separate from the work itself. A project management dashboard in a dedicated platform like Wrike lives in the same tool that captures the work, so updates flow into the dashboard automatically without manual data refresh. The practical difference is maintenance: Tableau dashboards require ongoing data preparation, while native PM dashboards refresh as the team works.