- What are the three ways to create a project timeline in Excel? You can build a Gantt chart, use a project timeline template, or create a timeline with SmartArt graphics.
- Why might Excel be troublesome for project timelines? Excel lacks collaboration features, requires manual status updates, and isn’t customizable for individual team members.
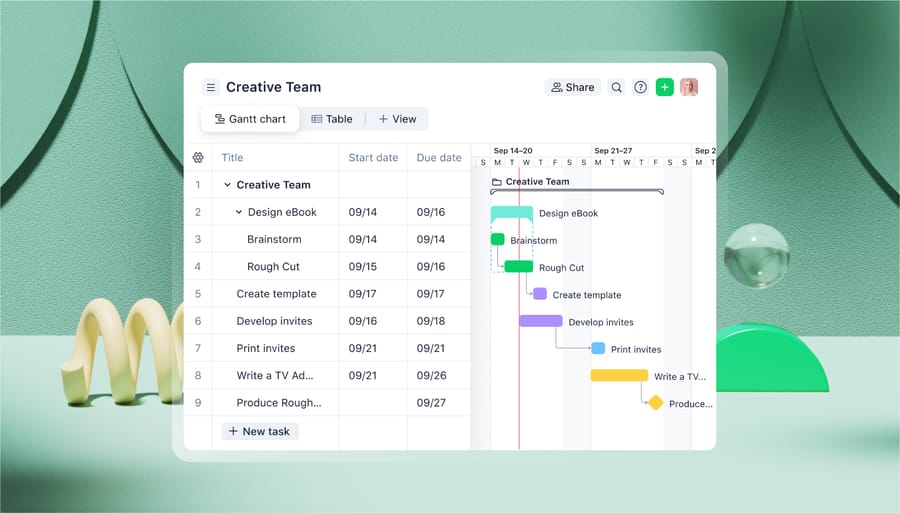
- What is a Gantt chart? A Gantt chart visually represents tasks, durations, and dependencies in a project timeline.
- Why is Wrike a better alternative to Excel? Wrike offers customizable, automated, and collaborative project timelines, improving workflow efficiency.
- How does Wrike enhance project management? Wrike provides real-time updates, personalized dashboards, and automation for setting up timelines, which Excel cannot do.
Love it or hate it, Microsoft Excel is one of the most commonly used tools in the workplace. If you’re looking to build a project timeline, the first tool you might reach for is Excel.
In this guide, we’ll show you three ways to build a project timeline in Excel. We’ll show you how to create a Gantt chart, use a project timeline template, and create SmartArt graphics, all within the program.
Before we do, though, it’s worth knowing that while it’s widely used, Excel can be a real headache for project timelines. To begin with, they’re really fiddly and frustrating to set up. But you’ll also find that Excel has some critical issues that mean your project timelines won’t always be as helpful as they could be. For example:
- Excel isn’t very collaborative, meaning multiple people won’t be able to easily edit your timeline at the same time.
- It doesn’t have automatic status updates. So, you’ll have to follow up on each task manually, and then update your timeline to match.
- It’s not at all customizable for each team member. Your teams can view the whole project, but not what they need to do individually.
It’s no exaggeration to say these problems can mean that creating timelines in Excel is just more trouble than it’s worth, particularly for more complex projects and organizations.
That’s why we’ll show you an alternative to creating a project timeline in Excel. That alternative is our platform, Wrike — a robust project management software that makes it easy to create customizable, automated, and collaborative project timelines.
How to create a project timeline in Excel: 3 options
A project timeline is a record of a project from start to finish. It should include the key tasks, deadlines, dependencies, and milestones, plus anything else you and your colleagues need to get the project completed on time.
Before you plot your timeline in Excel, you need to first understand and prepare everything that should go into your timeline. You can think through what to include and how with our guide on how to create a project timeline.
Once you’ve done that, you’ll have all the info you need to start drawing up your project timeline itself in Excel. There are three ways to do this, of varying levels of complexity.
1. Build a Gantt chart-style timeline from scratch in Excel
The most useful kind of project timeline that you can create in Excel is a Gantt chart. This is a visual representation of all the tasks, durations, and dependencies involved in your project.
The process of building one from scratch in Excel is time-consuming and complex (you’ve been warned!). But if you’re locked into using Excel, this is the only way you’ll have full control over how your timeline looks.
Here are our step-by-step instructions to build a Gantt chart in Excel.
a. Create and populate a table in Excel
To make a Gantt chart in Excel, your first job is to create a table, which will become the basis of your chart. Within that table, you’ll need to list each task in your project from start to finish, including all key decisions, milestones, and deliverables, each in a separate row.
In separate columns for each task, list the corresponding start date, end date, and duration. These will come in handy later on when you need to build out your timeline view itself.

Once you’ve done that, add a bar chart to your spreadsheet. You just need to click Insert, click the Bar chart option, and select the 2D stacked bar chart. It should appear as a completely empty white box.

b. Add start dates to your chart
At this point, the process becomes quite complex, so follow closely. First, you need to add each task’s start date to your chart. This enables you to plot the tasks on the timeline itself. To do this, follow the following steps:
Right-click your bar chart and click Select data. The Select data source window should appear.

Start by clicking the + symbol under Legend entries (series).
Click in the empty Name: field. The window should compress, so you can see your spreadsheet beneath. Select the Start date cell of the table you created in the first step.
Click the spreadsheet icon to the right of the Y values field to open the Edit series window.
Click on the Start date in your table, then highlight all your task start dates in your table.
Finally, click on the spreadsheet icon at the end of the Edit series form. The previous window should appear. Just select OK.
Now, your bar chart should include your tasks’ start dates. Again, don’t worry if it doesn’t look very much like a timeline at the moment.

c. Add the task durations to your chart
Next, you’re going to have to repeat this process entirely to add task durations to your project timeline. Just like start dates, this is crucial information to help you track deadlines and your project progress.
So, let’s go through that process again.
Right-click your bar chart, click Select data, and click the + symbol under Legend entries (series).
Select the empty Name: field. Now, click on the column title Duration cell in your table.
Click the spreadsheet icon next to the Y values: field to open the Edit series window.
Select the first duration in your table, then highlight all the task durations in your table.
Click the spreadsheet icon to the right of the Edit series form, then select OK.
Now, you’ll have both start dates and task durations in your project timeline. Again, it won’t look much like a timeline just yet. But at this point, you only have a couple more steps to go before you have your Excel Gantt chart.

d. Add your task names to your chart
You have the start dates and durations of tasks included in your timeline. But you need to include the actual task names too.
This requires some more diving into Excel’s complex settings.
Right-click on any of the bars in your chart and select Select data.

Click the spreadsheet icon to the right of Horizontal (category) axis labels.
Highlight the names of the tasks in your table. Do not select the name of the column itself (Task name), only the names.
Click OK and OK again.
e. Format your Gantt chart

At this point, you’ll have a chart with all the information in it you need. However, it won’t be quite right yet.
For instance, the tasks themselves will be in reverse order. To arrange your tasks in the right order, firstly right-click your list of tasks and select Format axis. Select the Categories in reverse order checkbox.

Plus, the chart itself may still not look visually appealing. This is an unfortunate aspect of Excel in general. However, there are some ways you can improve the appearance and make the chart make more sense as a timeline.
- Hide the blue part of each bar. To do this, right-click on the blue part of a bar and choose Format data series. Click Fill and select No fill. Then click Border color and select No line. You can also then delete the unnecessary bar chart key if you need more space.

- Remove the white space at the beginning of your chart. To do this, right-click on the first date listed under Start date in your data table and select Format cells. You’ll need to write down the number that’s listed under General, before returning to Date and clicking Cancel. In your chart, you can then right-click on the dates above the bars and select Format axis. Change the Minimum to the number you’ve written down, then close.


- Remove the white space between the bars. To do this, right-click on the top red bar and select Format data series. You can set Gap width to 10% (or whatever you choose).

There you have it! At this point, you have completed your Gantt chart in Excel.
2. Create a project timeline with a template
The process outlined above is hardly intuitive. If you can’t make your way through each step of arranging data and formatting your tables, you can use a template to build an Excel project timeline.
This approach will save you time. However, it does mean that you’ll be following a project structure based on someone else’s workflow. As your organization and your projects will be unique, these templates may not make sense for you at all.
If you want to try out a template anyway, you have a few options.
- Access templates directly through Excel. Simply click on New from template under the Excel File tab to find templates. You can type Timeline or Gantt chart into the search bar and you’ll be served many different templates. Choose one and click Create. You’ll be able to edit the template that appears, including the text, color, structure, and more. However, the more you want to edit, the more it makes sense to start from scratch.
- Download a template from Create.microsoft.com. There are many options to choose from, with different visuals, levels of detail, and structures. The benefit is that these are free. But if you have more complex projects to plan, they probably won’t be enough for you.
- Get a larger range of templates from third parties. Sites like Simplilearn and Vertex have a range of templates that you can download. You likely won’t find one that will match your project entirely, though.

As we said, these Excel templates can be great options if you don’t want to go through the hassle of creating your timeline from scratch. However, it’s important to be aware that they’ll still have the same problems that any Excel timeline has.
Simply, Excel is just not designed to be collaborative. So, if you want to give your teams a single source of truth that they can update once they’ve completed a task, Excel won’t be able to do that.
3. Create a simple timeline using SmartArt
Your final option in Excel is to create a timeline visualization using SmartArt. This is a much simpler option. By this we mean it’s simpler to build the timelines, but the timelines you can build will be much simpler too.
SmartArt won’t be useful if you want to build a Gantt chart, edit project subtasks, or see a more detailed view of your project. Instead, it’s more useful for tracking milestones or larger deliverables.
Here’s how you can build a SmartArt project timeline:
- In Excel, click Insert in the toolbar and find SmartArt in the Illustrations tab.
- On the left-hand side, select Process. This should show you only the timeline and process-related graphics.
- Then, choose which visualization you prefer. You can select a basic timeline in the form of an arrow, for instance, or use a chart that helps you track simple dependencies.
- Finally, edit the chart to show the information you need.

As discussed, SmartArt is an easy way to build simple timelines. They can be useful for sharing in reports or PowerPoint presentations, for instance.
However, they may leave something to be desired when it comes to detail. For a more complete view of your tasks, dependencies, and subtasks, you’ll almost certainly need a more sophisticated timeline.
Why you need an alternative to Excel project timelines
So far, we’ve shown you three different ways that you can create a project timeline in Excel. Whether you want a detailed Gantt chart or a simpler timeline visualization, Excel can help — if you’re prepared for an imperfect solution.
As you’ve seen, though, if you want to create a detailed timeline that’s custom to your project, Excel has serious limitations.
- It’s frustrating to set up if you want details on tasks, subtasks, and dependencies.
- It’s not collaborative, as Excel spreadsheets are unsuitable for editing by multiple team members in real time.
- It requires continual follow-ups for the information in the timeline chart to be up to date with the real status of the project.
- It duplicates work for project managers who have to insert information into the project plan.
- It doesn’t give individual team members a sense of what they actually need to do.
Plus, it’s not very scalable. In this post, you’ve seen how to set up a single timeline. But you’ll probably have multiple projects on the go at any given time, and for any other project you’ll need to build a new timeline in a different sheet from scratch.
As such, Excel can be quite limiting, particularly for organizations working on complex projects that involve a lot of people. Excel just won’t provide the visibility that everyone needs over all the details of the project.
Instead, complex projects need software such as Wrike, which can help you build project timelines that are customizable, collaborative, and comprehensive.
How Wrike makes creating project timelines a breeze
Wrike is a project management platform designed to improve collaboration and increase visibility for larger teams. Within Wrike, you can define, track, update, and measure all the projects you’re planning or working on.
Wrike functions as a single source of truth for projects. It’s where everyone can see what’s happening, communicate, and work collaboratively. Rather than you having to continually edit your timeline to keep people up to speed, Wrike will do all that for you.
As an alternative to Excel, we share three ways that Wrike helps you plan and manage projects.
1. With Wrike, build your project timeline in just a few clicks

Forget spreadsheet cells, formulas, and fiddly chart formatting. With Wrike, it’s effortless to set up a timeline that contains all the project information you need:
- Set up custom tasks and milestones that reflect the way you want to work. Simple Excel timeline templates are sometimes handy, but your projects are unique to your organization. With Wrike, you have full control over the structure of your entire project, so you can edit task names, how they relate to other projects, and much more, all in a few clicks.
- Define, edit, and view dependencies. Even with a Gantt chart view on Excel you can’t really understand task dependencies. And that means you can’t understand how delays may affect the entire project schedule. With Wrike’s sophisticated Gantt chart tool, you can view and edit dependencies in real time.
- Assign tasks and give team members all the information they need. Wrike lets you dramatically reduce manual work. For instance, in just two clicks, you can assign a task and let colleagues know what needs to be done. That means you don’t need to track a task in your timeline and send messages through separate channels to follow up. Instead, everything happens in the same place.

2. Track progress in customizable dashboards
Excel timelines give you a high-level overview of a simple project. What it can’t do is provide individual team members with information on what they need to do personally. Simply, it’s just not built for that.
But for large organizations, this matters. Everyone’s perspective on a project is different. They have different tasks, they’ll be working on different projects at the same time, and will need to see different information. Ultimately, for a project timeline to be useful, it’s no good if it’s just a single chart that no one can edit or customize.
This is a problem that Wrike’s dashboards are designed to solve. Wrike gives individuals in your organization a personalized view of their workflow and how that fits into wider projects. For instance, they can see their priority tasks across multiple projects and understand how dependencies affect them personally.
Plus, Wrike’s dashboard gives everyone a single place where they can find all the information they need for their project. Rather than having a project overview in an Excel file, task briefs sent over Slack, and feedback in a Google Doc, everything is unified for a much easier way of working. With Wrike, you can share resources, give feedback, request approvals, and check on the status of tasks and projects — all in one place.

3. Automate project timelines from intake to delivery
If you’re using Excel, you’ll need to set up a new timeline every time you start a new project. For any project manager or team leader, this inevitably means a lot of repetitive work.
Wrike removes this work entirely by automating the whole process of creating repeated timelines. It not only saves time, but it improves standardization across your organization — and ensures no tasks get missed.
For example, in Wrike, you can automate your timelines by setting up a dynamic request form. Thanks to these forms, every time someone requests work, the entire workflow can be automated from start to finish. In practice, this means Wrike’s automation sets up and assigns all tasks and defines all the dependencies and due dates in your project.
The result is less time spent defining timelines and more time doing actual work.
You can also track tasks in your project timeline with automated workflows that are tailored to your team. Create your own workflow with customized statuses that clearly let people know what stage comes next.
For example, a creative team might typically kick off their workflow with “In briefing,” before the task is moved to “In design,” “In review,” and “Approved.” These statuses can also be tied to specific automations, e.g., when the task is moved to “In review,” tag the requester.
Forget Excel. Choose Wrike for project timelines
So many organizations depend on Excel. But the reality is that it’s often not the best choice for the job at hand. Simply put, the timelines it creates are simplistic, uncollaborative, and frustrating to set up.
As an alternative, organizations with complex needs should use Wrike. It’s a robust, customizable workflow management tool that lets you build project timelines from scratch, and so much more.
Why not see how it works for yourself?