Key takeaways:
- What’s the problem with homemade project monitoring solutions? Monitoring projects using email, Slack, or spreadsheets is prone to human error and scales poorly.
- What should you use instead? It’s better to use a dedicated project management tool, but the level of monitoring functionality varies from tool to tool.
- How can Wrike help with monitoring? Wrike lets you keep an eye on your KPIs, your budget, and any risks you’ve identified. It’s easy to use and will save you a ton of time thanks to automations.
Project monitoring is a well-established concept in the world of project management. For those of you who want to know more about the formal approach, I’ll provide a short overview below.
But I won’t linger on definitions. Many of you will be searching for project monitoring because you want to learn how to monitor projects at work, not what project monitoring is.
So the majority of this article will be about best practices you can implement to improve your project monitoring. And I’ll make the case that the single best thing you can do is to use dedicated project monitoring software, such as Wrike.
Here’s what I’ll cover in this guide:
- Project monitoring: Definition and formal framework
- How to monitor projects at work: Three common approaches and their pitfalls
- Best practices for project monitoring (including an introduction to Wrike)
Project monitoring: Definition and formal framework
When most of us use the expression “project monitoring” in daily conversation, we’re referring to monitoring the progress of a project at work. We might be talking about:
- The overall progress of the project
- Progress in relation to specific KPIs around timelines, budgets, or outputs
But there’s also a more formal definition of project monitoring as an established concept within the field of project management.
Traditional project management divides projects into five steps:
- Initiation
- Planning
- Execution
- Monitoring and Controlling
- Closing
As you can see, project monitoring is the fourth of these steps. Traditionally, monitoring begins immediately after a project moves into the execution phase.
In the project monitoring phase, project managers compare the project’s progress against the initial project plan. For example, they track:
- Whether the project has stuck to its initial scope
- The quality of the output
- Whether the project is hitting key milestones on time
- The workload of individual team members
- Whether the project is being completed within its budget
If there’s a deviation from the original project plan, project managers take corrective action to ensure that the project meets its objectives. This is called project controlling, and it happens in tandem with project monitoring.
Ok, now that we have our definitions in the bag, let’s move on to the actionable stuff.
How to monitor projects: Approaches and pitfalls
Practically, people tend to monitor projects in three ways:
- In an ad-hoc manner, via email or channels such as Slack or Teams
- Through Excel or Google Sheets, either using a template or an improvised homemade solution
- With a dedicated project management tool
The pitfalls of ad-hoc project monitoring and spreadsheets
The only upsides of using email or spreadsheets to monitor projects are that your system is quick to set up and won’t cost extra money. But there are lots of downsides to taking a DIY approach. Monitoring projects in an ad-hoc manner via email, Slack, or Teams is potentially problematic, because:
- Important info can get buried in inboxes, overlooked, or lost, especially during long email threads or when staff turn over.
- Employees often have to rely on being pinged manually to see what they need to do next. This encourages reactive behavior, and it becomes almost impossible to manage at scale.
- If different teams use different channels or email threads, coordination suffers. For example, one team might work on a project that another team has already completed.
- When tasks are embedded in informal conversations, there’s no structured way to assign ownership, set due dates, or track progress.
Spreadsheets aren’t much better. For instance:
- Attempting to control access to sensitive project data via spreadsheet links is prone to human error. Unauthorized access can compromise data confidentiality.
- Spreadsheets lack built-in task assignment and tracking tools. It’s hard to monitor who is responsible for what, when tasks are due, or if they’re completed, which can lead to missed deadlines and unbalanced workloads.
- As projects scale, spreadsheets may crash, become cluttered, or become insufficient for handling complex dependencies like resource planning.
- Spreadsheets lack automated reporting, dashboards, and Gantt chart visualizations. As a result, stakeholders may not have clear insights into progress, risks, or budget overruns, making it difficult to make informed business decisions.
Project management tools are, of course, the way forward. And since one of the main functions of these tools is to give visibility into project progress, that’s not surprising. However, it’s important to remember that not all project management tools are created equal. Some have better project monitoring capabilities than others. We’ll make our case for using Wrike in a moment.
Also read:
- Project management software vs. Excel: What to consider
- How to create a project timeline in Excel (3 methods + an alternative)
Project monitoring software: Our case for using Wrike
- Overall project performance
- Quality control
- Budget and resources
- Risk
- Communication and reporting
In this section, I’ll show you multiple ways that you can use Wrike to effectively manage each of these elements. As you’ll see, it’s much simpler than using spreadsheets or email.
1. Monitor overall project performance
Part of monitoring any project involves ensuring that any KPIs or milestones you set during the planning phase are hit. Wrike has several features that make tracking the overall performance of your project smooth and easy.
For example, you can customize how you view Wrike in order to monitor whatever makes most sense for you in a given moment:
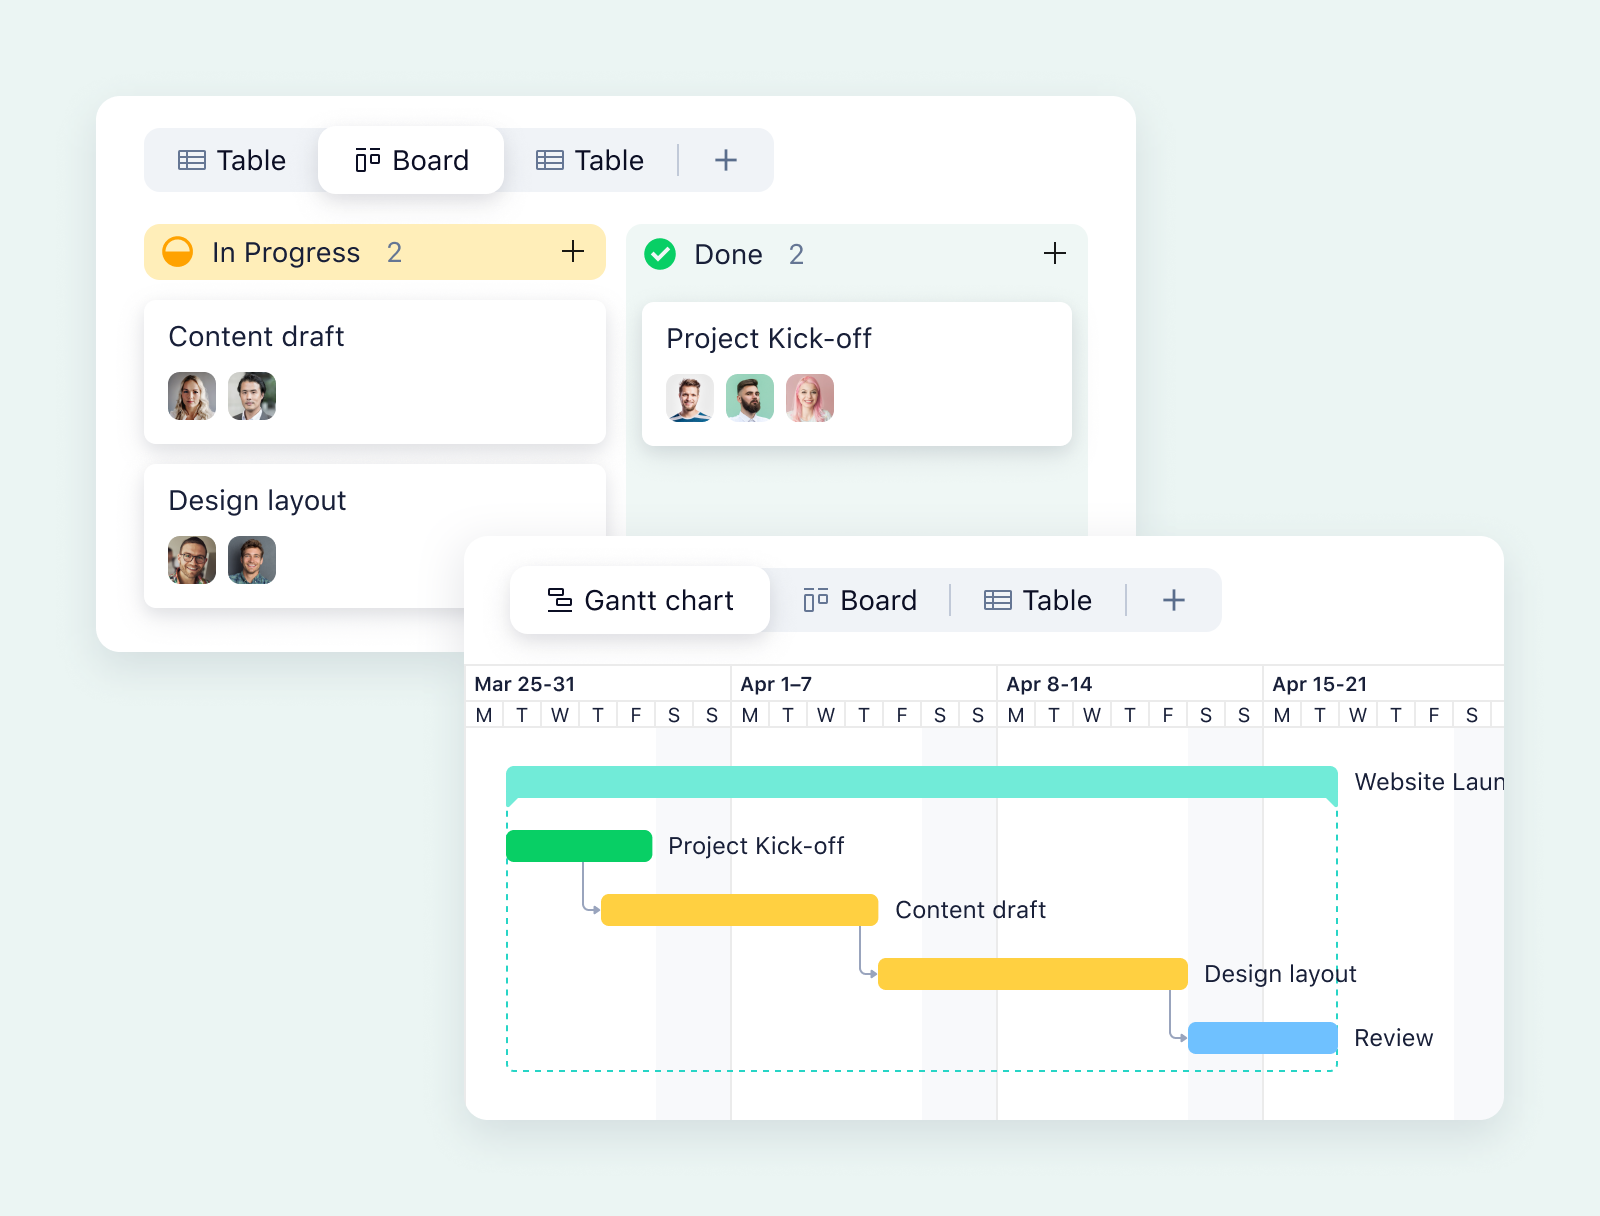
- The Board view allows you to view all the tasks for a particular project. Columns represent different statuses in your workflow, and each card represents a task.
- The Table view puts all your tasks, folders, or projects into a spreadsheet format. There are various modes that allow you to zoom in to see more tasks, or zoom out to get a sense of the bigger picture.
- The Gantt view shows all your tasks on a timeline as bars spanning the time between their start date and end date. This is really helpful for giving you an overview of your deadlines.
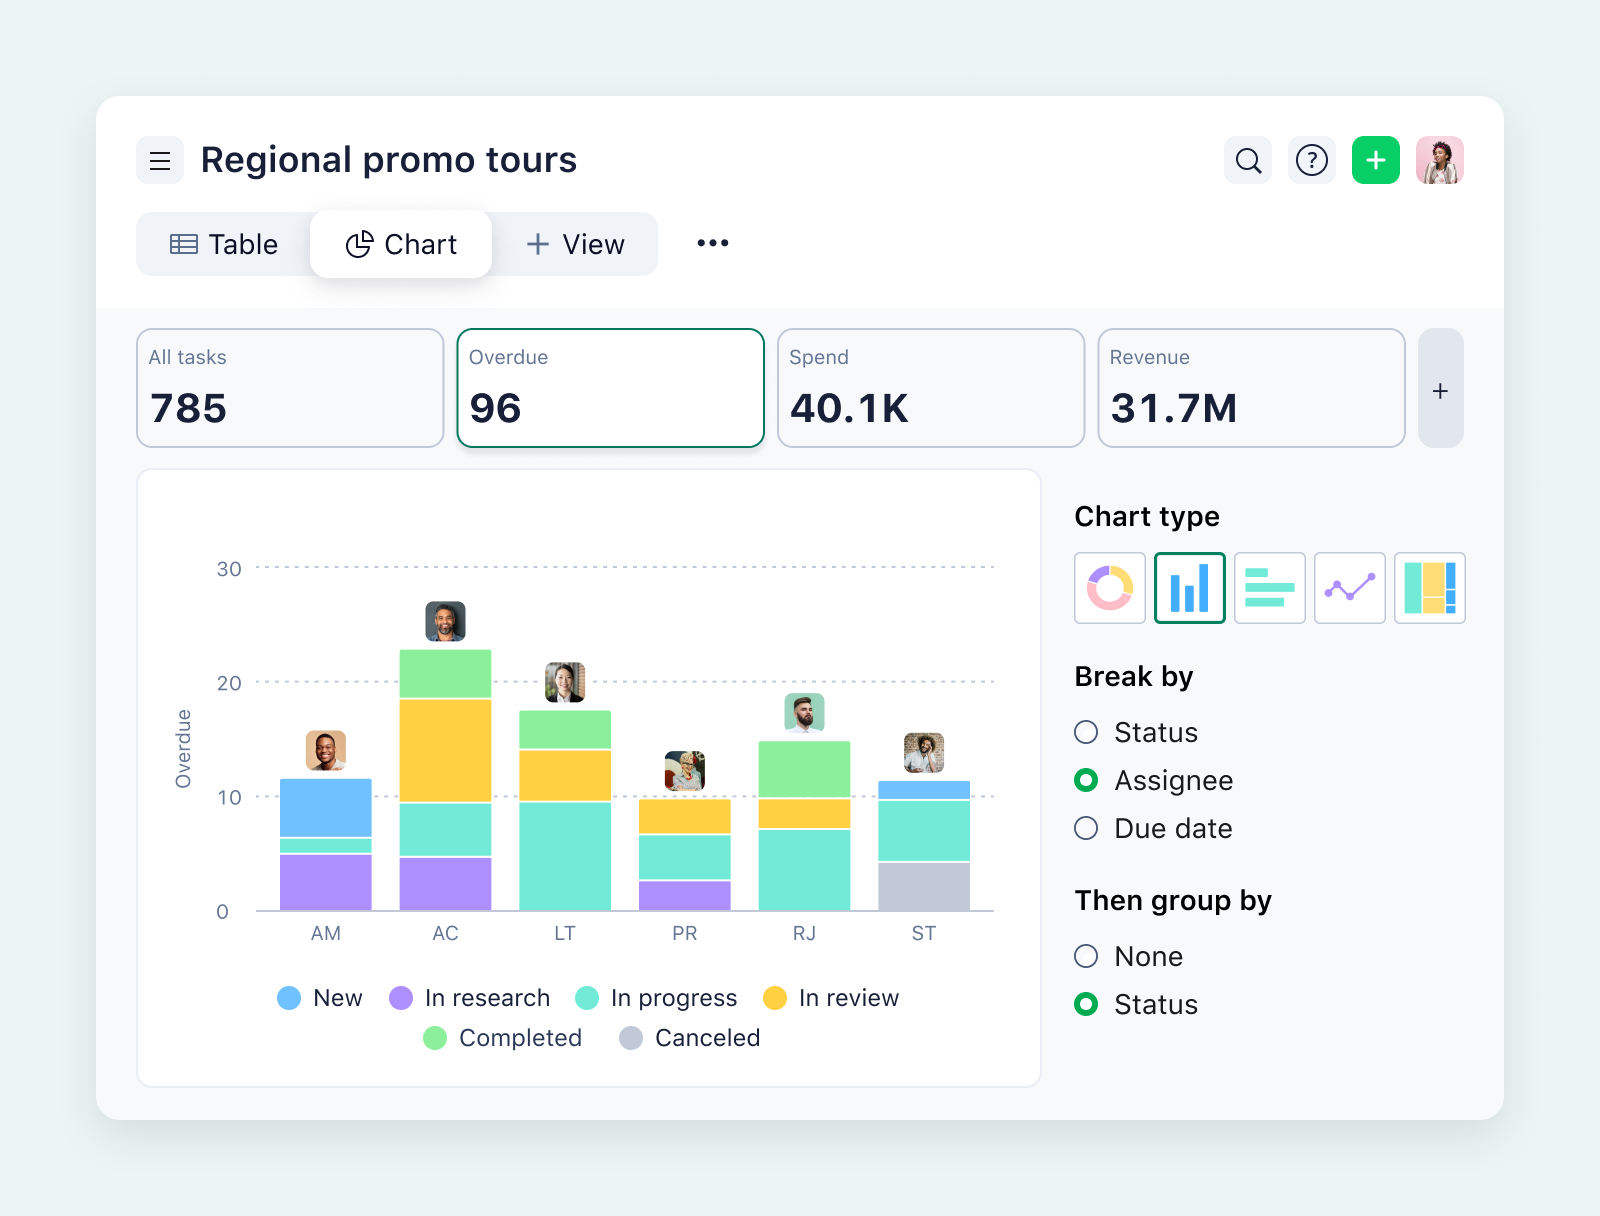
- The Chart view allows you to add various different metrics that are important to you, and then automatically creates a chart for each metric. You’re welcome to change the charts to fit your needs.
Wrike also lets you set up custom dashboards to monitor KPIs at a glance. You can customize which data is shown here, with a wide range of dynamic widgets, tables, charts, and boards available. Adding new elements to your dashboard is a simple matter of dragging and dropping.
In terms of analytics, Wrike has a built-in suite that lets you:
- Monitor the pace of your sprints in real time
- Create burndown charts
- Analyze billable hours
- Track the progress of your entire project portfolio
- Forecast the future of your project based on past trends
Once you’ve discovered an issue, Wrike offers a few different ways of logging it. For example, you could create a custom workflow status called “Problem” and tag a task with that status. Alternatively, you could create a custom request form and assign it to the department or employee responsible for that task.
If you need to make changes to your overall project, Wrike even has a change control template that you can plug and play.
2. Quality control

- Add a step for a QC review to a custom workflow
- Add a workflow step for approvals, which may also include guest approvals from third parties like contractors
- Add custom task statuses like “In Review,” “QC Passed,” or “Needs Fixing”
Proofing is simple with Wrike, since feedback, files, and approvals are all kept in one place. If you’re working with designers, our Adobe Creative Cloud integration will let you give them feedback that they can view without ever having to leave Adobe.
Wrike will let you pinpoint the changes you need to make, simply by clicking on an asset and marking where the edit needs to take place. To assign an edit to an employee, just send them an @mention — much faster than having to switch over to email.
If you need to discuss a suggested edit with a team member, you can easily do so by commenting on the asset itself. Once the changes are finalized, you can resolve the changes and mark the project as done.
In cases where you want to go back and look at a past iteration of a document you’re checking, Wrike also offers version control. You can easily track versions of files that have been attached to tasks and project folders.
3. Monitor budget and resources
Regularly reviewing budgets and other resources helps businesses ensure they don’t overspend or allocate resources they don’t have. To help with this, Wrike comes with a budgeting feature that allows you to track your financials across all your projects in real time.
You can customize:
- Your preferred currency
- The hourly rates for different users and job roles
- Fields that compare planned costs against actual costs
- Which users have access to viewing the budget
The easiest way to set this budgeting system up is to use our monthly budget tracker template. This lets you:
- Log expenses using a custom request form
- Sort expenses by category
- View monthly spending
- Generate prebuilt reports to get an overview of your budget
If you want to track your human resources, Wrike can help with that, too.
For example, our software makes it easy for employees to record how much time they spend on each task. Project managers can then use the Timelog view to see all the time logged on a particular task or project. Conveniently, Wrike will show you the amount billed for each allotment of time as well.
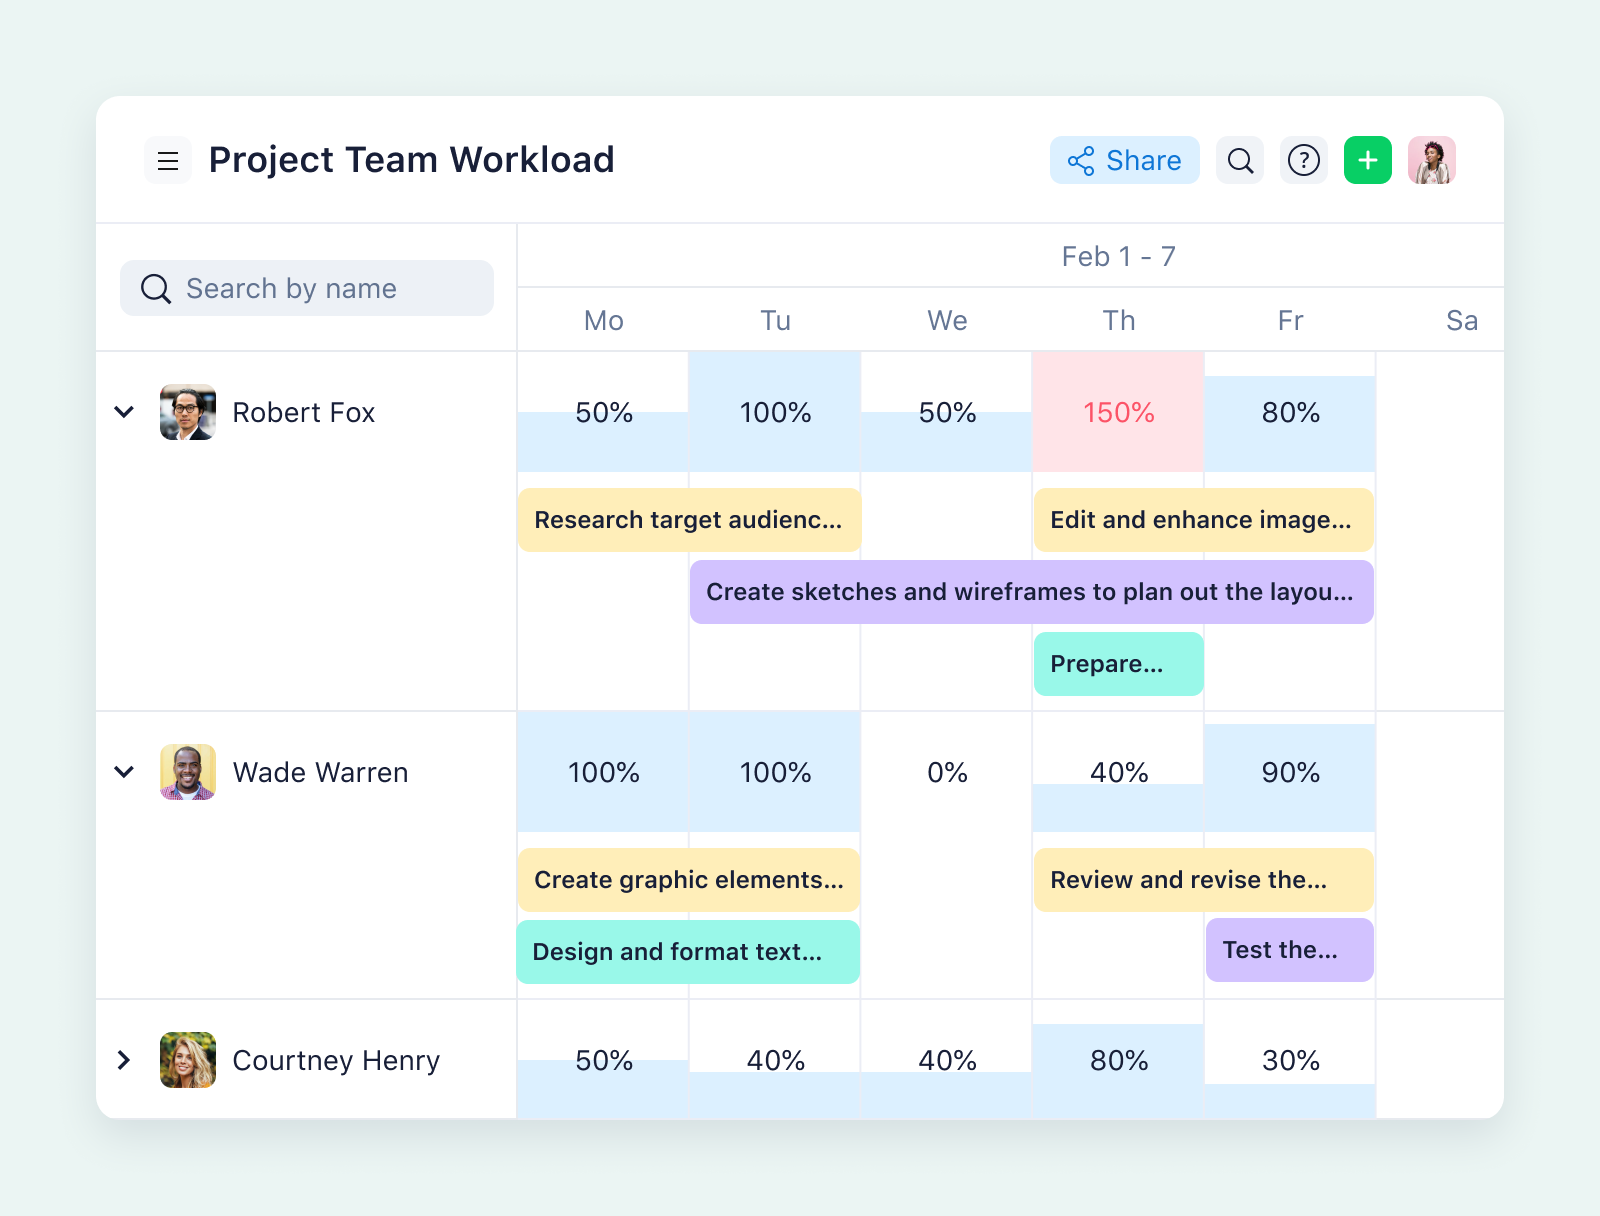
You can also use Wrike’s workload charts to compare employees’ workloads against their capacity and reallocate tasks if required. This is a great way to guard against burnout.
Or perhaps you want to compare the amount of time taken to perform a particular task against the amount of time you projected it would take to complete. In this case, Wrike’s resource bookings feature is super helpful. You can use it to store effort estimations for each project, allocate resources accordingly, and then monitor to see if your projections were accurate.
4. Risk monitoring and mitigation
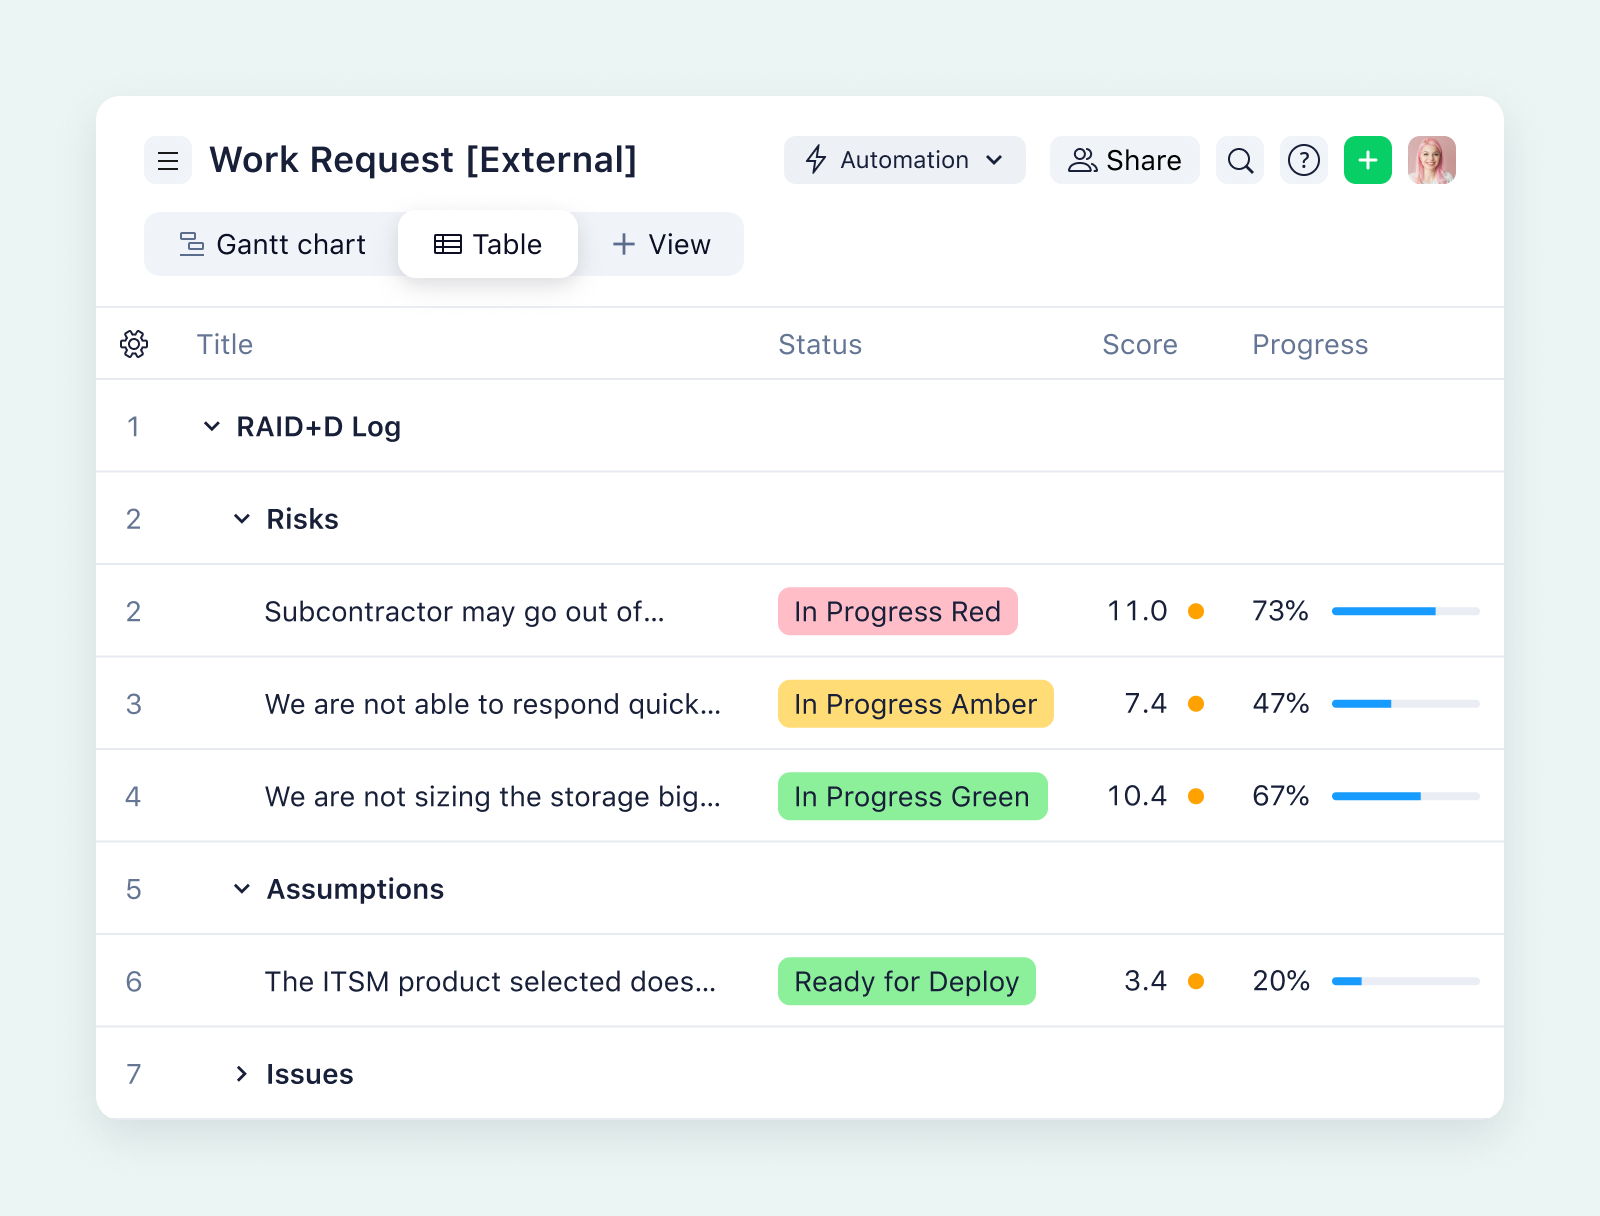
For instance, you could use Wrike to make a risk log. Add a folder called “Risk Log” to your project, and tag any tasks that are particularly high-risk. Once you’ve identified tasks that are high-risk, you can create custom fields to grade them 1-5 in terms of impact and probability. Then, when monitoring your project for risks, focus on the tasks that have probable and/or high-impact risks.
If that sounds too complicated, there are other ways you can use Wrike to automate parts of your risk management. For example, add a RAID entry to your request forms, and every new task will automatically prompt you to assess it for risk.
Even more straightforwardly, Wrike’s machine learning will automatically predict future project delays based on an analysis of the start and end dates of previous projects. All you have to do is monitor the predictions to see if they’re accurate, and take action to keep the project on track.
My personal favorite way to get started with risk monitoring on Wrike is to use our risk analysis template. This is something you can plug and play to:
- Categorize risks using folders
- Manage risks through a dedicated dashboard
- Create RAID entries with request forms
- Create risk reports for different stages of mitigation
5. Stakeholder communication and reporting
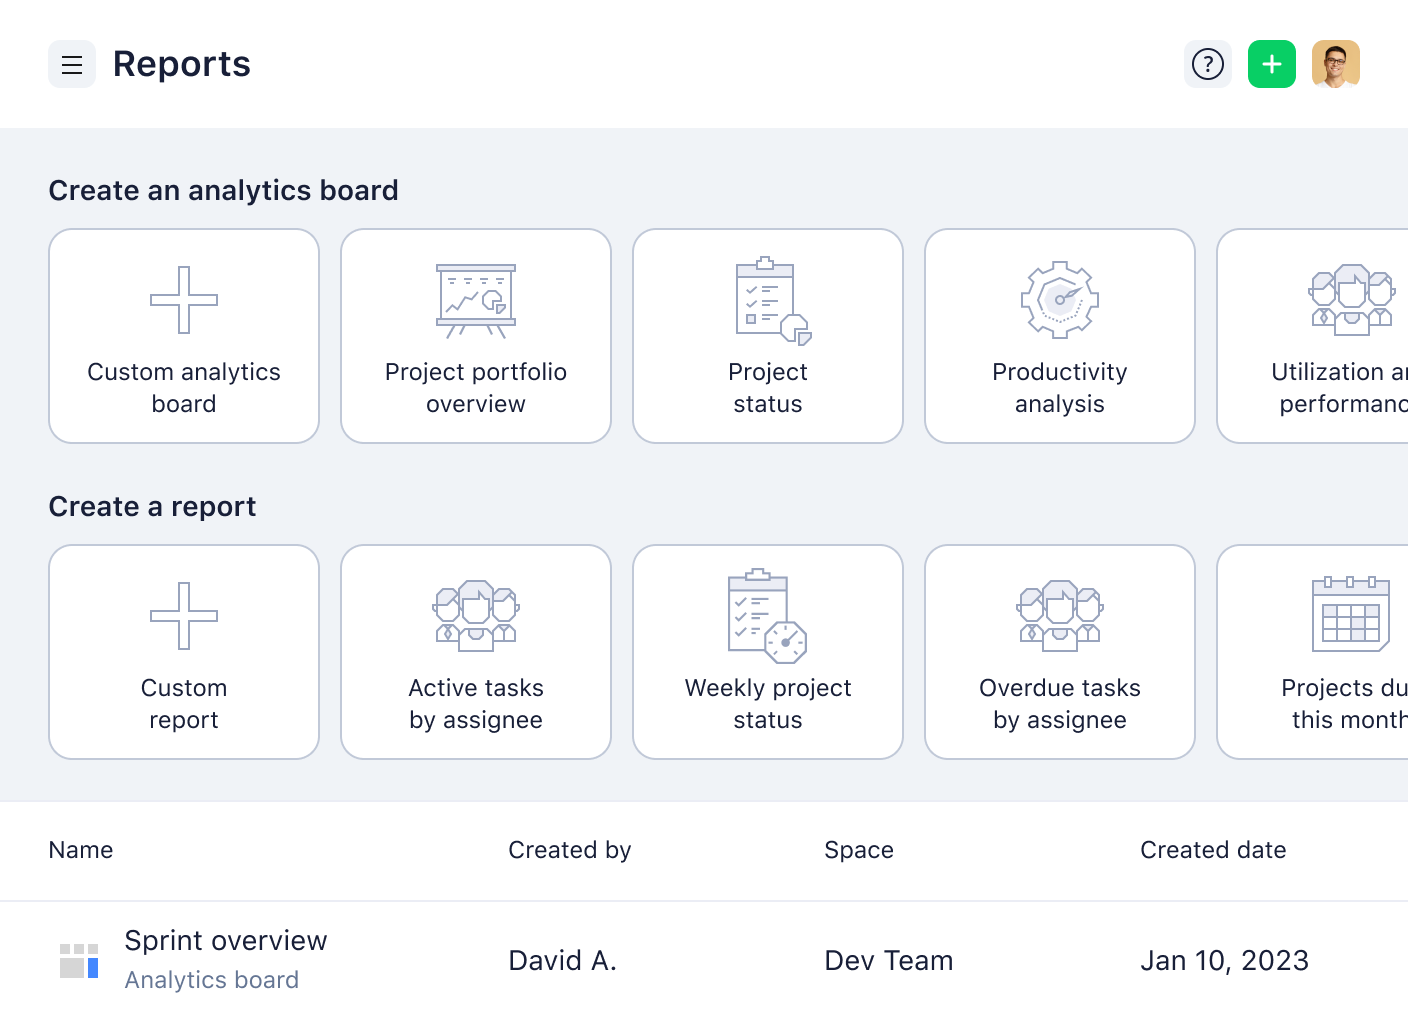
The final piece of the monitoring puzzle is communicating with other people on your team. This could include sending reports to senior management or telling employees when you see a problem that needs fixing.
Wrike makes it incredibly easy to generate reports and send them to the relevant stakeholders. It’s literally as simple as clicking on “Reports” in the sidebar and then selecting from one of the available report templates.
If you prefer, you can also create a custom report instead. Either way, your report will automatically populate with the most up-to-date data from your project. It will even auto-update as new data comes in!
Need to get hold of one particular team member to fix a problem you discovered while monitoring? Simply @mention them, and they’ll get a notification on their computer, their phone, or both.
Likewise, if you need to reassign work to a different team member, doing that will automatically create a notification in Wrike, so it’s easy for your colleague to see.
If you’d like to check the history of comments for a particular task, Wrike can help you with that, too. Our software automatically generates a stream of notifications for each task, folder, and project. So in your monitoring process, you can read back through the notification stream in order to find whatever information you need.
Wrike makes monitoring projects a breeze
When monitoring your projects, don’t try to reinvent the wheel and create a homemade system using spreadsheets and emails. A system like that might be faster to set up, but you’ll probably find that it’s incredibly difficult to keep track of everything, especially as you scale up operations.
Wrike’s dedicated project management software can save you headaches and a huge amount of time. We have dozens of templates that are ready to plug and play, as well as automatic reporting features and dynamic dashboards that offer a bird’s-eye view of all your projects.
Don’t believe me? Give Wrike’s free trial a spin and see for yourself!


