
Decode data with Wrike’s advanced analytics reporting
Boost your decision making processes with powerful reporting and BI tools. Turn raw data into actionable insights.

Initiation
Create reports in a click
Start your data journey effortlessly. Our intuitive interface makes building reports from templates a breeze, meaning you can get to work right away.

Visibility
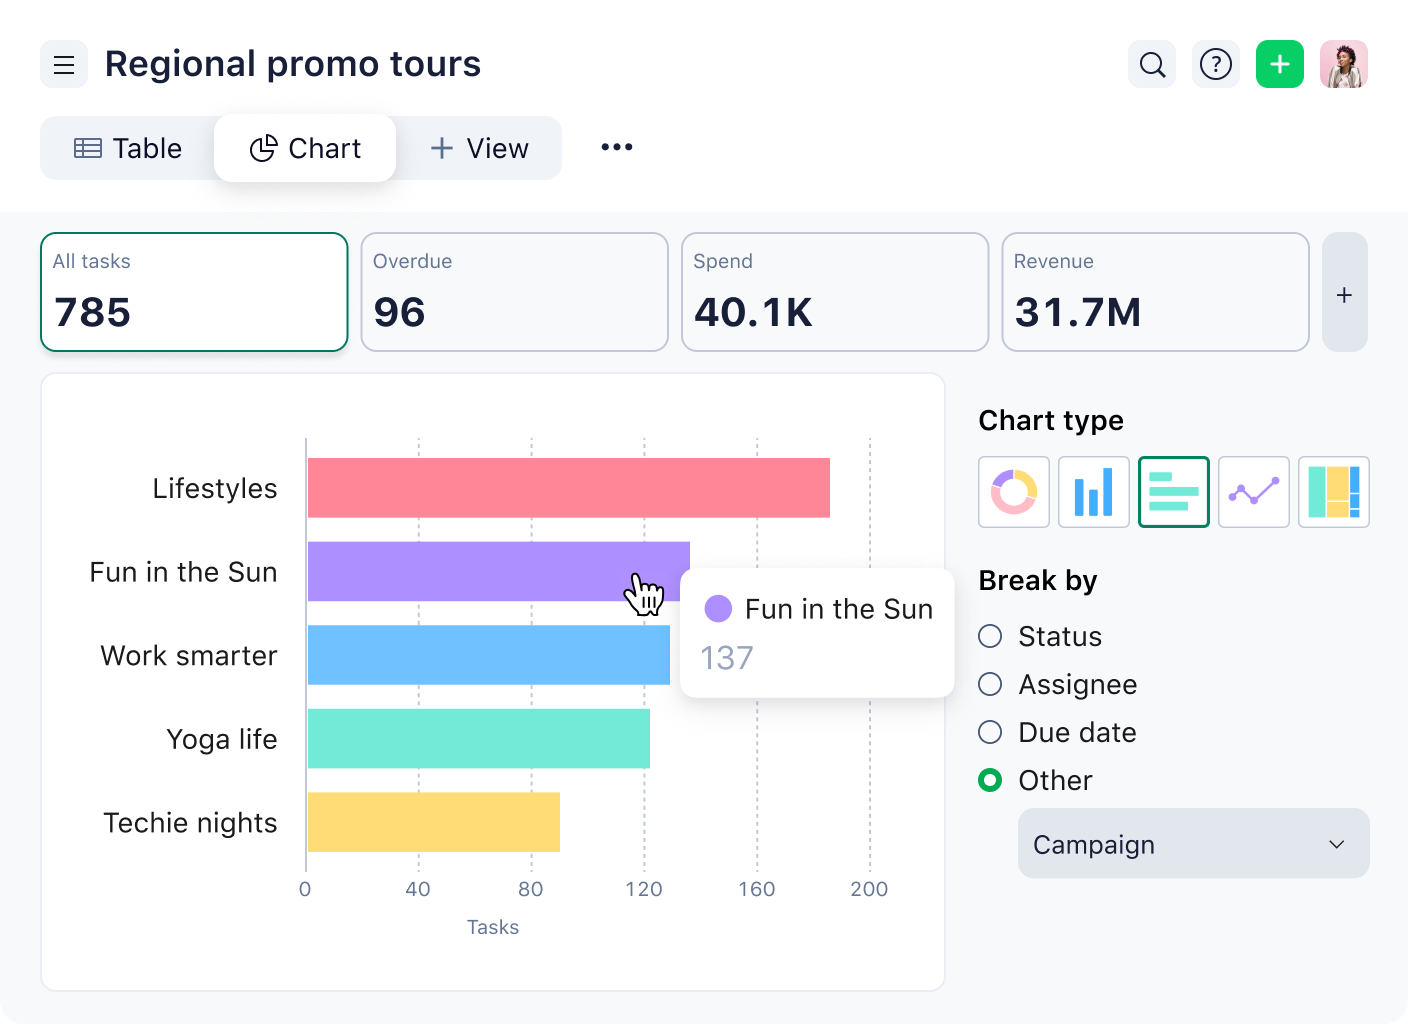
Amplify insights with interactive widgets
Visualize key data with our dynamic widgets. Whether you’re looking for tables, charts or boards, adding widgets is simple — just drag and drop.

Customization
Personalize reports to get the info you need
Tailor your analytics boards to reflect your business objectives and track corresponding metrics accurately. Customize widgets and take advantage of advanced formulas and filters.

Forecasting
Analyze trends for future projects
Build your own crystal ball with Wrike’s analysis and forecast features. Observe trends, identify patterns, and predict future outcomes based on your historical data.
Initiation
Create reports in a click
Start your data journey effortlessly. Our intuitive interface makes building reports from templates a breeze, meaning you can get to work right away.
Visibility
Amplify insights with interactive widgets
Visualize key data with our dynamic widgets. Whether you’re looking for tables, charts or boards, adding widgets is simple — just drag and drop.
Customization
Personalize reports to get the info you need
Tailor your analytics boards to reflect your business objectives and track corresponding metrics accurately. Customize widgets and take advantage of advanced formulas and filters.
Forecasting
Analyze trends for future projects
Build your own crystal ball with Wrike’s analysis and forecast features. Observe trends, identify patterns, and predict future outcomes based on your historical data.
Monitor your sprint progress
Gauge your team’s pace in real time. Use burnup or burndown charts to achieve sprint goals without team burnout.

Enhance productivity with performance analytics
Analyze billable hours, team effort, and resource allocation with Wrike’s utilization and performance report. Boost your efficiency to keep projects on course.
Navigate your project portfolio wisely
Oversee your progress with the project portfolio status report. Track key metrics with KPI widgets and project breakdowns to guide your management decisions.

“I can’t live without reporting. I can pull a report and, within minutes, I can pivot it any way I want to without exporting it to Excel.”
“It took us from no visibility and educated guesswork to a clear picture of each staff person's workload and capacity during the busy season.”


![]()