There was a time early in my career when I thought being a good leader meant doing everything myself. I’d jump in, solve problems, answer questions, chase updates, and somehow still feel like I didn’t have control.
Then, someone introduced me to the idea of clearly defining who’s doing what and who’s not. That whole concept is called the RACI model, and that simple shift changed everything for me.
If you’ve never used a RACI chart before, or you’ve only heard the term in passing, this article will walk you through what it is, how it helps, and what it looks like in action. And if you’re looking for something practical to work with, you can use Wrike’s RACI template — available to test during a free two-week trial.
What is a RACI chart?
A RACI chart is a simple project management tool that maps out roles and responsibilities across the project team so there’s no confusion over task ownership. It improves collaboration by categorizing each role as Responsible, Accountable, Consulted, or Informed.
The RACI can also be referred to as the responsibility assignment matrix. I’ve used this framework on complex projects that require multiple stakeholders, and it consistently brings clarity when things start to get complicated.
RACI meaning
As mentioned, RACI stands for:
- Responsible
- Accountable
- Consulted
- Informed
Let me take you through what each role means and how I’ve seen them play out across teams of all sizes.
Responsible
This is the team member who is actively working on the task. They’re the ones writing the code, designing the page, running the report, or collecting the data.
This is the role that most teams default to. People often assume if you’re on the task, you’re responsible for finishing it. That’s true, but in a RACI chart, this role is labeled, which makes it easier to track project progress and hold the right people accountable later.
One thing I’ve learned is that you can have more than one person responsible, especially on tasks with multiple key stakeholders. But too many hands can slow things down, so you should always try to keep it focused.
If the project roles are unclear, use Wrike to break down the task into subtasks and assign each one to a specific person. For example, instead of assigning ”launch campaign” to three people, you can split it into “write email copy,” “design creative,” and “set up automation,” with one owner for each. This keeps responsibilities clear and helps avoid confusion or duplicate work.
Accountable
The accountable person oversees overall task completion. This role often causes confusion, especially when the project team assumes that responsibility and accountability are the same. They’re not.
An accountable person isn’t necessarily doing the task. They’re there to ensure project tasks are completed and expectations are met.
In some cases, the accountable person is a project manager. In others, it might be a business analyst, department lead, or client contact. The point is that there’s only one.
Research from McKinsey & Company suggests that only 20% of organizations excel at decision making, a problem likely made worse when there are too many people sharing accountability. If more than one person is assigned as accountable, it becomes harder to know who owns the outcome.
Here’s what you should typically expect from the accountable person:
- Sign off on major decisions
- Monitor project tasks and timelines
- Remove blockers for the team
- Communicate with key stakeholders
- Own escalations when things go off track
- Review and approve the final deliverable
When you are working with highly skilled teams, always make sure this role is explicitly stated in the RACI matrix because it’s the glue that holds ownership together.
Consulted
The consulted individuals provide relevant information for completing tasks. When creating a RACI chart, you should always identify key stakeholders with technical insight or historical knowledge that could steer your project in the right direction.
In some teams, this role is skipped entirely, which usually leads to costly rework later. So, I make a point of pulling them in at the right time, especially during the project planning phase.
Informed
This role tends to get ignored, but leaving someone out of the loop can create way more drama than it should. These team members are updated on project progress without being consulted.
They could be:
- Senior executives
- Finance teams managing the budget
- Adjacent departments that rely on the output
- Clients or external partners waiting on delivery
- HR or compliance teams that monitor alignment
When I’m using a RACI chart on complex projects, I include this group to prevent surprises. You can also leverage live communication channels like a shared dashboard to keep them up to speed in real time.

RACI matrix example
If you’re still unclear on what a RACI chart should look like, here’s a basic setup I’ve used as a project manager for a website launch. The format stays the same no matter how complex the work gets.

Key:
- R = Responsible
- A = Accountable
- C = Consulted
- I = Informed
What are the benefits of RACI charts?
I’ve been part of enough enterprise-level product rollouts to know that most issues don’t start with bad intentions. When you use the RACI framework to set clear expectations at the task level, every team member knows their roles and responsibilities. RACI charts offer many benefits that could improve your project outcomes.
Here’s what I’ve found to be the most important benefits of creating a RACI chart in project management.
Better decision-making process
A well-built RACI matrix puts a spotlight on the decision maker. Everyone knows who has the final say, who gets consulted, and who’s just kept informed. This clarity speeds up problem-solving and helps enhance team efficiency.
Increases communication
According to Project Management Institute: ”The RACI chart serves as the baseline of the communications plan by stipulating who receives information, how frequently, and at what level of detail.” When everyone knows who needs to be looped in, who needs to be asked, and who needs an update, you naturally reduce noise.
Encourages accountability
In every project planning process, there’s a need for an accountable person to identify tasks and workload. Without that person, the team can stall, and risks can go unflagged. However, when the accountable role is clear, the project moves faster, and every team member has enhanced clarity in roles.
Improves Agile transitions
RACI charts are particularly useful for outlining responsibilities in Agile transitions. You can align new project roles, define roles and responsibilities, and ensure each team member understands how they’re expected to contribute.
Eliminates confusion on task roles
One thing I love about creating a RACI chart is how useful it is later in the project. During handovers, escalations, or when someone new joins mid-project, the chart becomes a quick reference guide that speeds up context transfer.
Now that you know the benefits of a responsibility assignment matrix, the next question you ask yourself is, “Do I need one for every project?”
While the exact answer will depend on your unique needs, you can use the below chart to help you tease it out:

What are the limitations of RACI charts?
As useful as the RACI matrix is, I’ve learned not to treat it like a silver bullet. In one project planning session, I had a business analyst involved throughout the product cycle. Labeling them as just “Consulted” didn’t reflect their hands-on input or their influence on key decision-making moments.
Also, the RACI model looks neat on paper, but projects are rarely that tidy. Sometimes, a team member plays multiple roles at once. This fluidity is hard to capture in a static framework or RACI matrix.
The moment a chart goes stale, it loses its power. If you don’t review and update it regularly, people stop trusting the chart.
If you use RACI charts, you will notice it doesn’t show power dynamics. A junior team member listed as “Responsible” may still hesitate to act without buy-in from someone more senior, even if that person isn’t officially the decision maker. If you ignore that reality, the complexities involved can often make the chart feel disconnected from how decisions get made.
How to make a RACI chart
I’ve created RACI charts for marketing campaigns and internal culture projects, and here’s how I typically approach them:
1. Identify all project roles
The first step in any project planning and management process is to compile a list of everyone involved in the tasks. This can include:
- Team members
- Managers
- Department heads
- Stakeholders
In one project, I made the mistake of only listing job titles and later realized we had two team members with the same title handling different roles and responsibilities. That led to confusion about ownership. Since then, I’ve leaned toward names for clarity, especially when there’s any overlap.
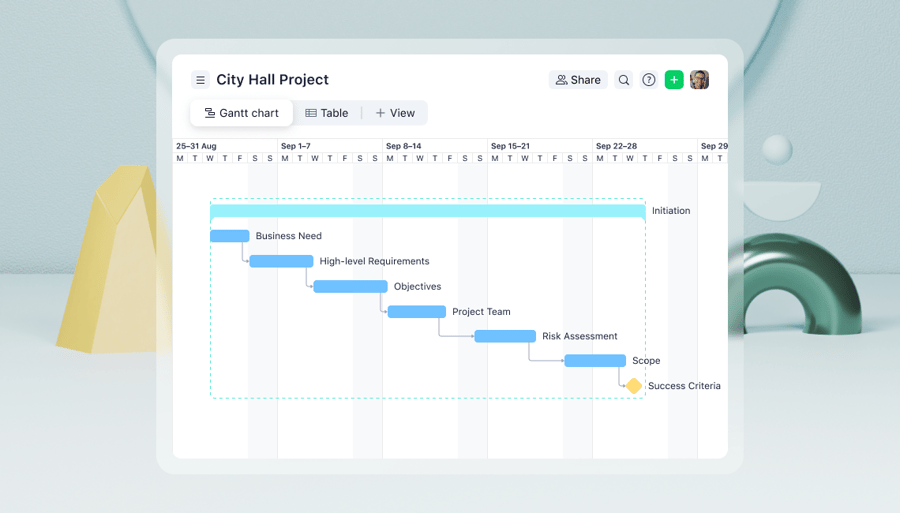
You should also try to map out roles for each team member to avoid anything that could cause delays and errors. You can even use Wrike’s popular Gantt chart tool to create dependencies and milestones so you can better understand your project’s progress.

2. Identify all project tasks
Now that I have all the roles (or the individuals responsible for various tasks), it’s time to list the tasks themselves. Tasks can be broken down into any of the following:
- Activities
- Deliverables
- Milestones
- Important decisions
All tasks you identify will go down the vertical axis of your RACI chart so that you can easily connect them to the various roles you’ve laid out. It can be tempting to create a lengthy list covering every single task imaginable, but sometimes, less is more with a RACI chart to avoid anything that can often lead to confusion.
3. Set up the chart structure
Once I’ve got my roles and tasks, I bring them together into a chart. If you love creating graphics and animations, you can add color coding to your RACI model to make it easier to skim through, especially for stakeholders who appreciate visual cues. Otherwise, keep it clean and to the point.
You can build a RACI chart in Confluence, Excel, Google Sheets, or directly in Wrike. It’s easier to share, edit, and embed into our weekly check-ins or dashboards. Plus, it keeps the chart as part of your project management process. This way, you can track progress, budgets, and team assignments in one place, like in the example below, so it’s not just a side document that gets ignored.
4. Assign RACI to each role and task
When the RACI chart looks like how I want it, the next step is to assign the RACI to each role and task. That means identifying who is:
- Responsible
- Accountable
- To be consulted
- To be informed
For every:
- Task
- Deliverable
- Decision
This means adding the letters R, A, C, and I into your chart where it makes sense to do so. For example, if your head of marketing has to be informed when you publish a blog post, find the head of marketing’s name on the top row and the task “publish blog post” in the left-hand column. Then, add the letter I in the corresponding box between them.
Bear in mind that not every task will require every letter. For instance, some may need you to specify who’s responsible and accountable.
Some tasks might also involve support roles that assist project team members but do not take on full responsibility. Typically, only one person should be accountable for each task. If others are involved, they should be consulted or informed.
5. Review with your team and all involved stakeholders
I’ve seen too many RACI charts get created in isolation, only to fall flat when the project kicks off. That’s why I always share the draft early and review it with the full project team. Regularly reviewing RACI charts helps identify and address imbalances in roles and responsibilities.
We usually walk through the chart together. As a project manager, I’ll ask each team member if they’re comfortable with their roles and responsibilities. This helps everyone get a clear understanding of the project’s purpose.
You can also check in with stakeholders who aren’t as close to the work but might have feedback. Regularly reviewing the RACI matrix helps you achieve a streamlined and efficient workflow.
RACI chart best practices and rules
The RACI chart itself is only half the job. The other half is how you get others to use it. So, here are some rules and best practices for implementing a RACI matrix in project management.
Keep accountability singular
It sounds simple, but it’s the rule I see broken most often. That’s why I always make sure each task has a single responsible party, even if it feels a little strict. This rule is non-negotiable for me. It supports faster decision making and keeps task ownership crystal clear.
Integrate with your project management software
When the chart lives alongside your tasks, timelines, and communication tools, it becomes part of how the team works. Integrating RACI charts into project management software enhances accountability.
Use the chart to drive conversations
When creating a RACI matrix, never treat it like a paperwork exercise. Instead, use it to prompt conversations. Assigning tasks to the responsible party helps teams surface assumptions and discuss overlaps.
Don’t overfill the chart
A common mistake I see project managers make is adding too much.
That might mean too many tasks. Or too many roles. Or even too many layers of “Responsible,” “Accountable,” and “Consulted” in every row. If that happens, it starts to resemble a spreadsheet that no one wants to even look at.
Bear in mind that the chart should be lightweight enough that people refer to it without dreading it.
If you want your RACI project management matrix to give you the best results, follow these rules:

RACI chart real-life examples
Creating a RACI matrix soon? Below are two RACI chart examples I’ve worked through in some form or another, showing how roles come together.
Example 1: Writing a white paper
I once led a project for a B2B product launch, and part of the strategy involved creating a detailed white paper. We had a content team, a freelance SEO specialist, and a few execs who wanted visibility into the process.
Here’s how the roles and flow looked in that project:
Roles involved:
- Writer
- Editor
- SEO specialist
- CMO
Key responsibilities:
- Research and first draft
- Editing and fact-checking
- Keyword strategy and SEO optimization
- Publishing and stakeholder updates
Now let’s see how the RACI chart would come together:
- R (Responsible): The writer handled the research and writing
- A (Accountable): The editor owned the quality and final approval
- C (Consulted): The SEO specialist weighed in on keyword usage and on-page elements
- I (Informed): The CMO received updates when the draft was final and ready to go
Example 2: Developing a software application
On one app launch I worked on, we had six or seven roles involved, and without a structure, things got muddy fast. That’s where the matrix helped us lock in who was doing what and when.
Roles involved:
- Project manager
- UI/UX designer
- Developers
- Testers
- DevOps engineer
- Technical writer
Key responsibilities:
- Defining app requirements
- Designing user flows and interface
- Building frontend and backend
- Running QA and user testing
- Deployment and infrastructure setup
- Writing documentation and support content
Our RACI chart looked something like this:
- R: I worked with the product team to outline requirements, while developers owned the build
- A: Developers were accountable for the app being delivered as scoped and on time
- C: QA and testers gave feedback during development and flagged issues early
- I: I kept key stakeholders in the loop with progress updates and release notes once documentation was drafted
RACI template: Streamline your project management
When I first started building RACI charts, I always set them up from scratch. This worked, but it was time-consuming.
Eventually, I realized that using a RACI template can be a shortcut. It gives you a consistent structure to work from, and once you’ve built a flexible one, it’s easy to tweak, duplicate, and reuse without starting over.
That’s why I started using Wrike’s RACI template and never looked back. And I’m far from the only one seeing the value here.
Siemens Smart Infrastructure recently rolled out Wrike across 20+ countries and 14,000 users. With a complex business involving everything from commissioning and procurement to third-party contractors and Environmental, Health, and Safety (EHS), they needed a way to get everyone on the same page.
As Hannes Leitner, Process Owner Project Execution, put it:
“We wanted to reduce labor time so we could be more competitive, and at the same time offer a collaboration tool on a global scale.”
Wrike offered Siemens Smart Infrastructure a central hub with custom workflows, strong security, and templates that allowed teams across different regions and disciplines to stay aligned.
In Wrike, we create project templates and end-to-end workflows to fit the reality in the countries ... We created a flexible project template, where the project reflects the size and complexity of the customer project. And we also customized Wrike according to four different building disciplines: comfort, security, fire safety, and energy and performance services.
Hannes Leitner, Process Owner Project Execution
RACI chart alternatives
Not every team or project type is well suited to the RACI chart and, as such, it’s a good idea to have a few alternatives.
Here are three RACI alternatives that serve a similar purpose but suit different needs:
CARS
The CARS model stands for:
- Communicate: Anyone who should be consulted or informed
- Approve: Anyone who approves requests and makes key decisions
- Responsible: Anyone who carries out the work
- Support: Anyone who supports the responsible individual in completing the tasks
The CARS model is different from the RACI chart in that it breaks everything down further, making it easier to differentiate and identify the nuance in various roles and responsibilities.
Best for: Highlighting close working relationships where one party supports another
DACI chart
The DACI chart stands for:
- Driver: Anyone who does the work
- Approver: Anyone who approves requests
- Contributor: Anyone who contributes to or is consulted on a task
- Informed: Anyone who should be informed about the project’s ongoing status
If you’re looking for a more action-based model that outlines the main drivers of progress and the decision makers in the form of approvers, then the DACI chart might be a better fit than the RACI model.
Best for: Projects where someone will take the lead and guide the action forward, deliberately supported by approvers and contributors
RASCI matrix
The RASCI matrix stands for:
- Responsible: Anyone responsible for completing tasks
- Accountable: Anyone who is accountable for the project
- Supportive: Anyone who can lend a hand to the responsible team members
- Consulted: Anyone who should be consulted
- Informed: Anyone who should be informed about project progress
Similar to the CARS model, the RASCI model takes a similar approach to RACI but adds space for supportive roles.
Best for: Standard projects that require additional internal or external support
Clarify roles with Wrike’s RACI template
Now that you’ve seen how the RACI chart or responsibility assignment matrix works, you probably know how powerful this tool can be. Teams like Arvig, Estée Lauder Companies, and RPM Last Frontier use Wrike’s template on projects where they need to make work flow without obstructions.
That flexibility is what makes Wrike’s RACI templates different. You can scale up or down, assign roles automatically, and align with standard operating procedures. All of that is a huge win for any global organization.
On the template, my favorite thing is that I can set it and reuse the same steps over and over again to create consistency and transparency. Wrike naturally created efficiencies, so that we were able to handle 25% more accounts than forecasted, just because we can now handle it faster.
Kassandra Taggart, President and Owner
If you’re looking to bring more structure to your project management and help your team work with clarity, try Wrike’s RACI template today.
RACI chart FAQs
What are the 4 components of RACI?
The four components of RACI are “Responsible,” “Accountable,” “Consulted,” and “Informed.” Each represents a level of involvement in completing a task or decision.
Is RACI outdated?
No. RACI remains a widely used and effective tool for clarifying roles and responsibilities in projects, especially in cross-functional or complex teams.
Is a RACI chart efficient?
Yes. RACI charts can help build team efficiency by reducing confusion and speeding up decision making.
What is the golden rule of RACI?
Each task should have only one accountable person. This ensures clarity and avoids confusion over who owns the final outcome.
What’s the difference between a project plan and RACI?
A project plan outlines the scope, timeline, and deliverables. A RACI chart focuses on role clarity, defining who is responsible, accountable, consulted, and informed for each task.
What’s the difference between responsible and accountable in RACI?
Responsible refers to the person doing the work. Accountable is the individual who owns the task and ensures it’s completed correctly.
When should I create RACI charts?
RACI charts are most useful at the start of a project, especially when multiple people or departments are involved, to avoid role confusion and improve collaboration.