

Gantt chart software: manage projects without barriers
Wrike’s Gantt chart software manages impactful work from beginning to end and helps users create workflows without limits.
DEPENDENCIES AND MILESTONES
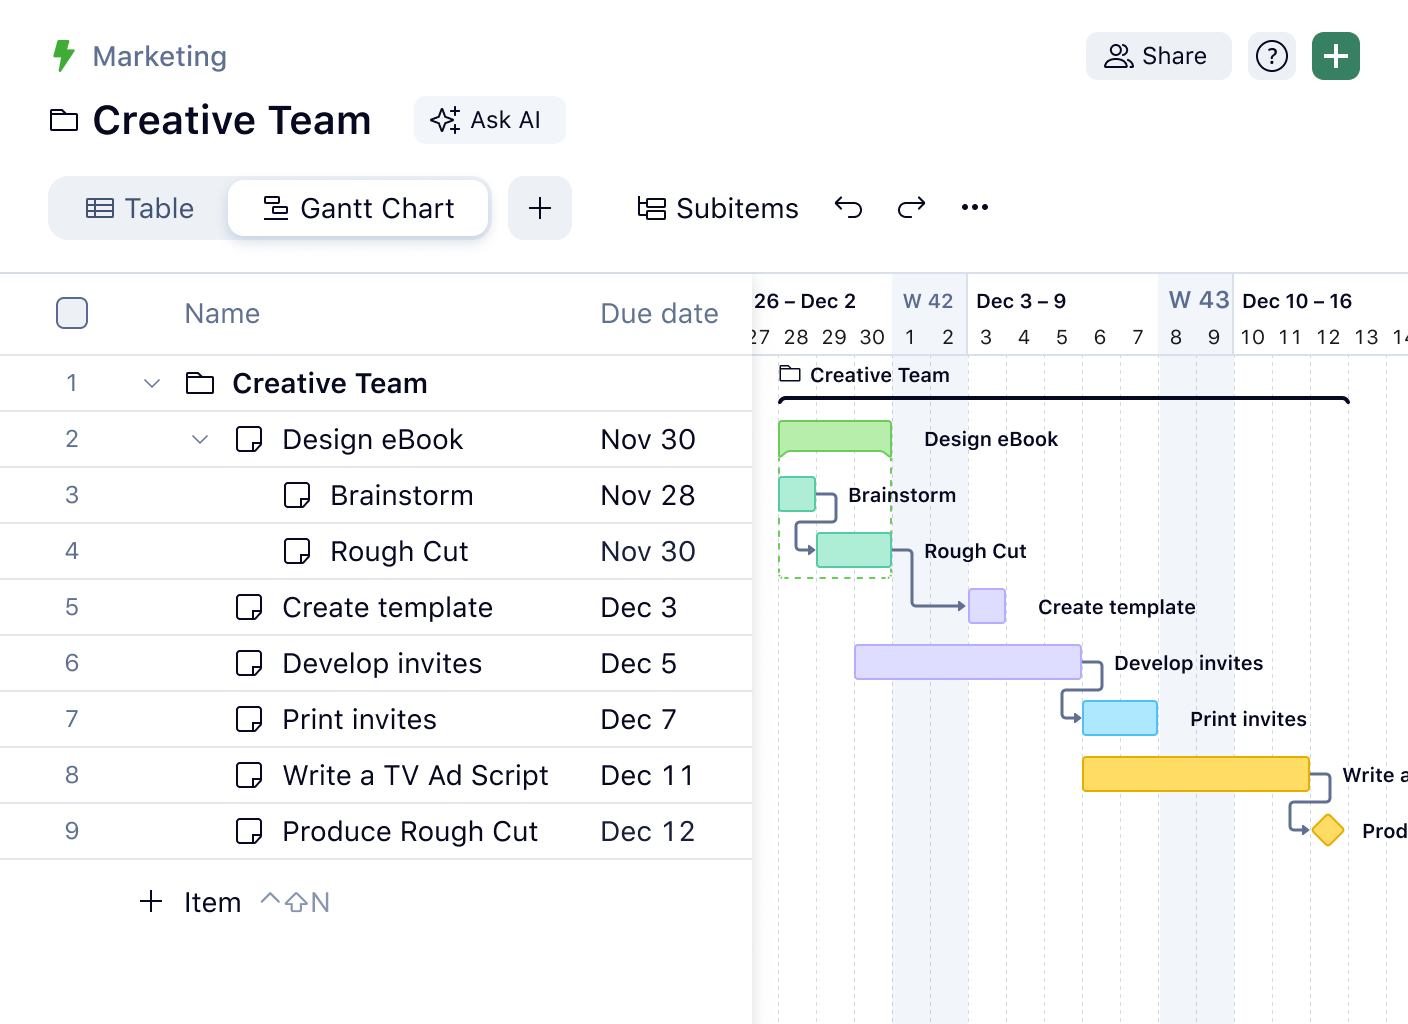
Create dependencies and milestones
Wrike Gantt chart tools allow you to create task dependencies, which will be automatically scheduled after the related task.
Visualizing milestones gives you a better understanding of your project’s progress. Milestones are perfect for marking major events in your project, such as the end of a project phase, important decision points in a project management, or critical events.
DRAG & DROP
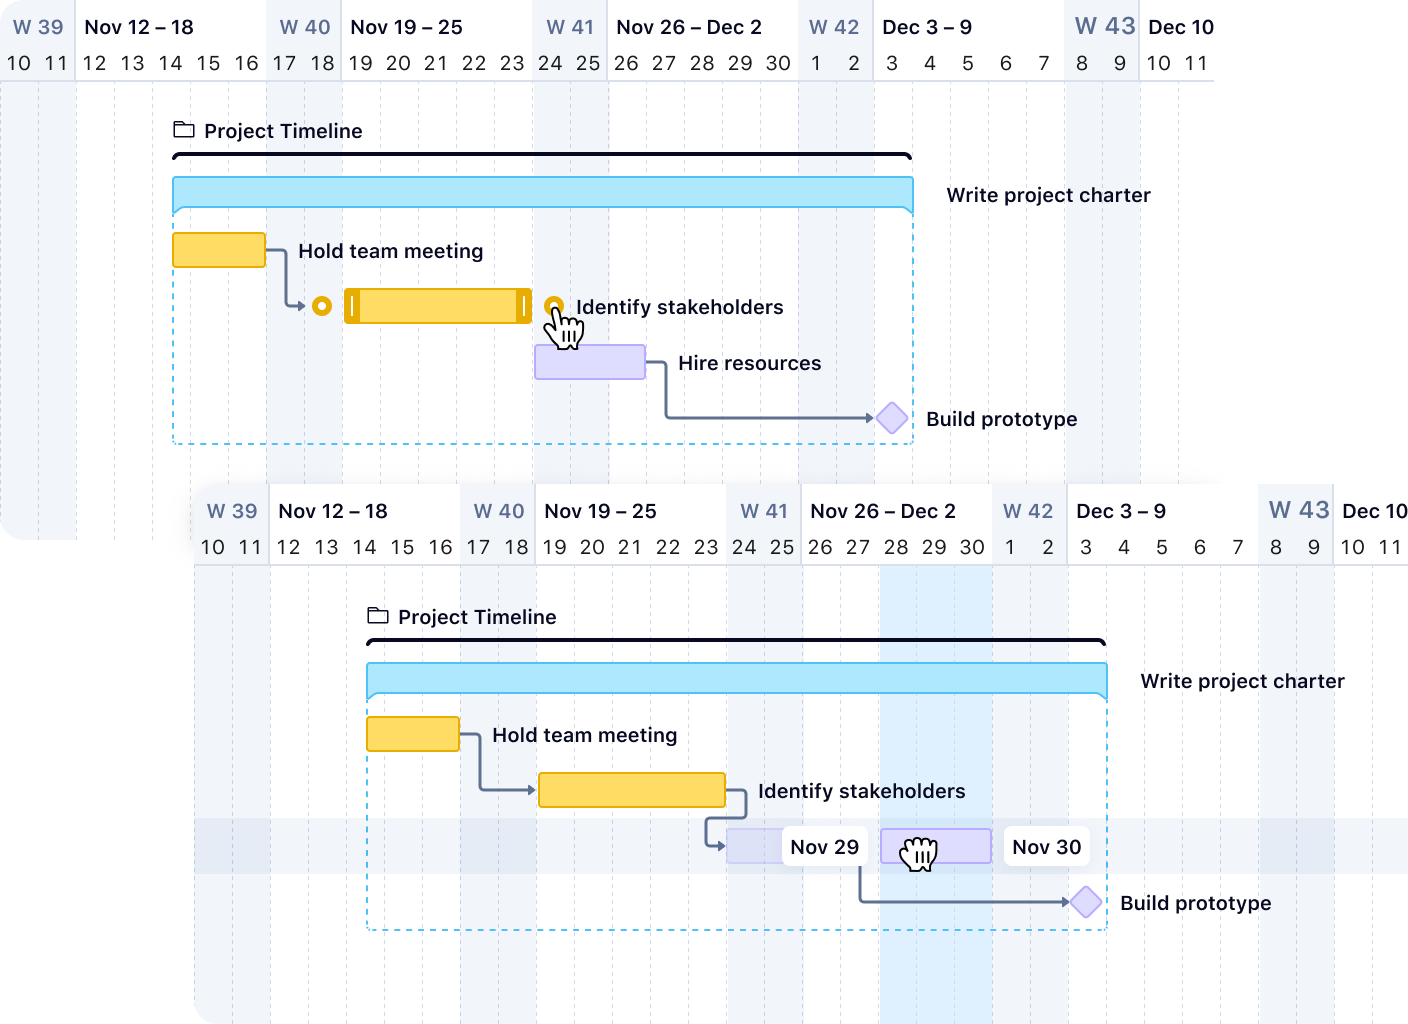
Reschedule tasks in bulk
Need to adjust your Gantt chart? Easily change dates and deadlines, drag and drop tasks, and reschedule tasks in bulk. When you reschedule a task with dependencies, all dependent active tasks are instantly rescheduled on the project timeline. Our project scheduler’s timeline automatically adjusts around your changes and shares new details with your team in real time.
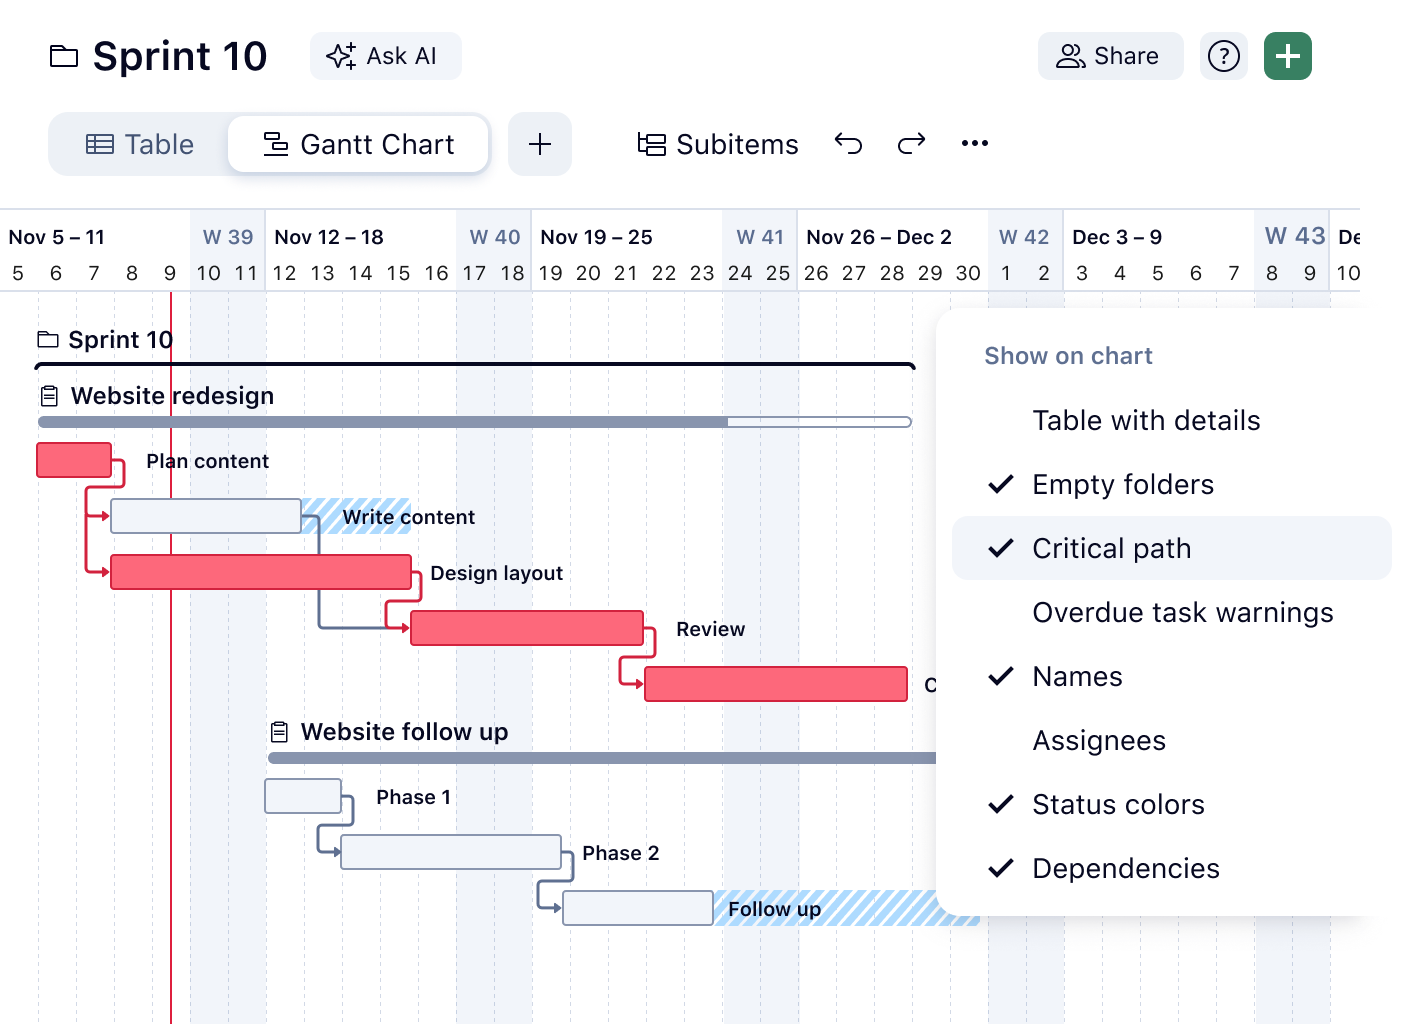
ENHANCED CRITICAL PATH
Critical path tracking and milestones
Wrike's enhanced critical path shows the exact sequence of dependent tasks that determine your project's finish date. Milestones are fully supported, keeping the critical path continuous and reliable across your schedule.
Filter your project schedule to show only critical tasks, so project managers can instantly spot what's driving the deadline — no spreadsheet export required.
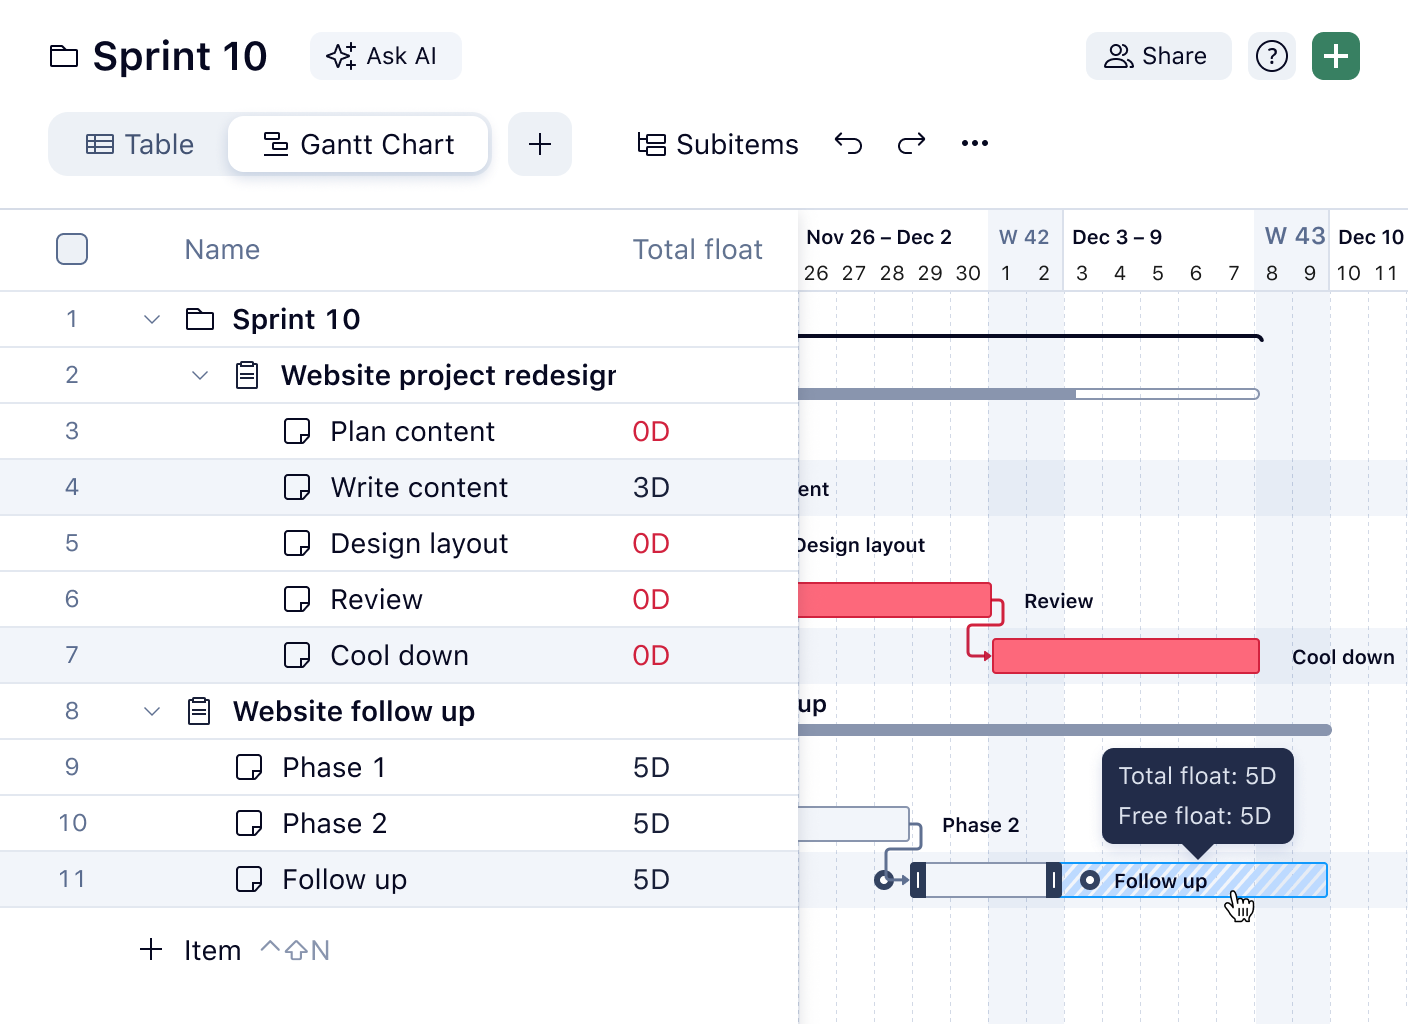
FLOAT VISIBILITY
Task scheduling and float
Total float and free float are now visible directly in the Gantt chart and as dedicated columns in your project schedule. See exactly how many days a task can slip before it impacts your project's finish date.
Negative float instantly flags tasks already behind schedule. Drag and drop tasks to adjust dates, and all dependent tasks automatically reschedule in real time.
BASELINE TRACKING
Project baseline tracking
Baseline tracking records your original project plan into reportable fields, not just a visual snapshot.
Capture your baseline at project kickoff, then track schedule variance in dashboards and custom formulas to calculate planned vs. actual delivery dates across projects.
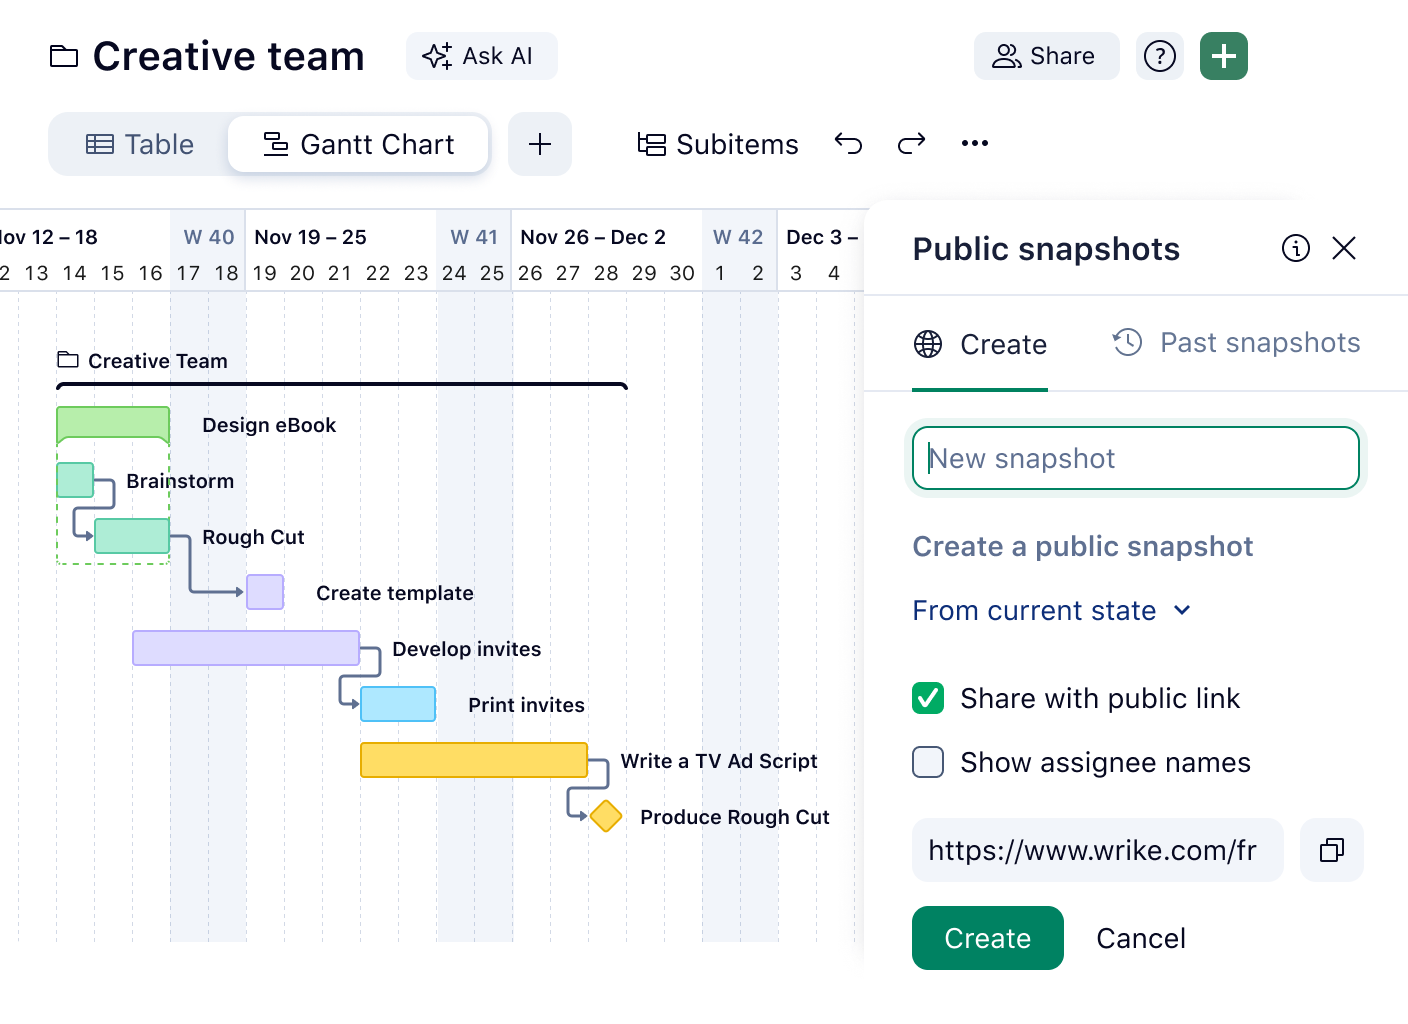
COLLABORATION
Share and communicate easily
Wrike’s Gantt chart software makes it easy to share work with anyone inside or outside your organization via secure public links or snapshots of your current timeline. Use grouping to quickly organize your view, and when you adjust assignees, dates, or project duration, your team members will know straight away. Need a hard copy of your online Gantt chart? No problem — simply print it out!
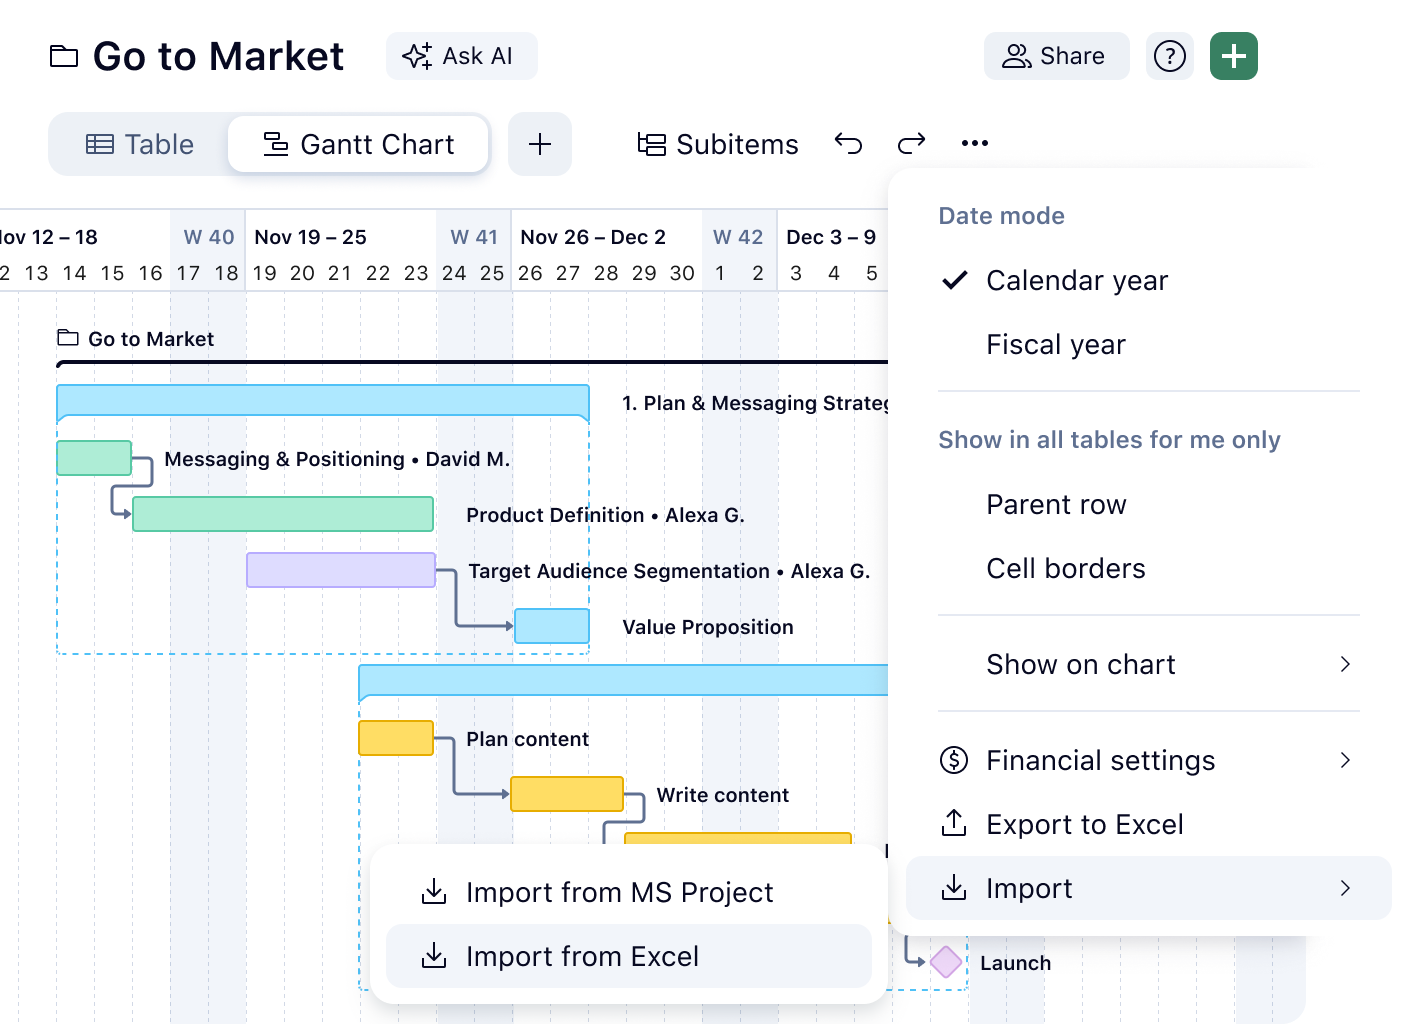
IMPORT FILES
Import all your data
With Wrike’s Gantt charts, there’s no need to manually copy information from spreadsheets and other project management applications. Import files and all your durations, dependencies, and responsible parties will automatically be carried over to our Gantt chart software.
With our drag-and-drop builder, project managers can visualize progress and dependencies. Our simple user interface allows you to use critical path analysis to spot bottlenecks.
Wrike’s Gantt chart software allows you to control multiple project plans from one platform, using critical path analysis, snapshots, and baselining.
Add .MPP, .MPX, and .XML tasks to Wrike. All your durations, dependencies, and responsible parties will be carried over to your Gantt chart.
“With Wrike’s timeline view [Gantt chart], the entire planning process can be visualized and adjusted. It’s easy to see how tasks are related to one another. TeamViewer’s marketing squad finds this incredibly useful: depicting the dependencies and status gives you a good overview of what needs to be done and what’s going to happen.”

“The timeline view in Wrike was always really great because you could visualize it, you could simply drag and drop, you could slide the dates over, and you could create dependencies in a graphical way, as opposed to having to go through a bunch of UI. Just being able to literally grab the arrow and drag it was always really helpful.”

“We work faster, update key dates for deliverables much more quickly, and eliminate human error. We’ve likely saved around 200 or more hours per year in our launch prep.”


Wrike has the most powerful Gantt chart software on the market. Here is a roundup of the market leaders for Gantt charts.
![]()