Key takeaways:
- What is an online Gantt chart? An online Gantt chart visually represents project tasks over time, making it easier to update timelines and track dependencies automatically.
- Why are project kickoffs critical? A strong project kickoff aligns teams on goals and expectations, reducing common causes of project failure such as unclear goals and inaccurate time estimates.
- How can Gantt charts prevent task dependency issues? Gantt charts highlight task dependencies, ensuring tasks are completed in the right order and fostering accountability among team members.
- What role do Gantt charts play in facilitating handoffs? Gantt charts help visualize handoff timings, ensuring smooth transitions between task owners and minimizing information loss.
- How do Gantt charts enhance project progress tracking? Gantt charts provide an immediate overview of project status, helping project managers avoid losing sight of overall progress amid detailed tasks.
As the project manager, you know that it’s your job to keep all aspects of an assigned project on track. But let’s just say it: That’s not always an easy task.
The left hand doesn’t always know what the right hand is doing. Deadlines are missed or completely forgotten. Updates and important information are miscommunicated. And before you even realize what’s happening, the whole house of cards can come tumbling down around you.
Fortunately, there are some tools and resources at your disposal — like Gantt charts — that make it easier to keep an eye on your projects and prevent them from running off the rails.
What is an online Gantt chart?
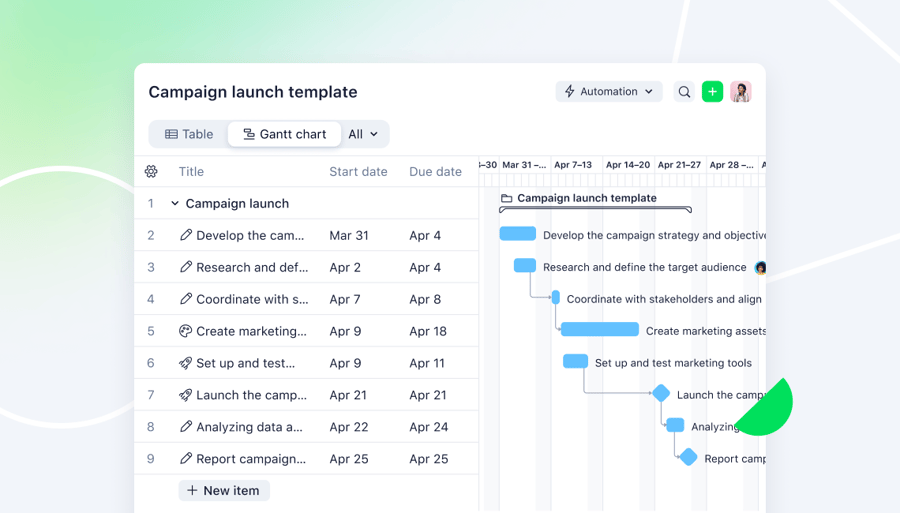
A Gantt chart displays project-related tasks compared to time. On the chart, tasks are represented by horizontal bars, and the length of those bars indicates the estimated amount of time that the task should require to complete.
One of the best ways to understand a Gantt chart is to actually see one. So, here’s a look at a Gantt chart that displays the tasks involved with a team project:

The above chart was created using Wrike. While Gantt charts can be created manually using spreadsheets or other tools, many teams quickly realize it’s time to stop making Gantt charts in Excel and use an online Gantt chart maker instead.
Why does it matter? By making a Gantt chart online, you’ll have a much easier time making updates if something changes — if, say, a task runs over the deadline or the order needs to change.
When using an online Gantt chart creator, things like your timelines and even your task dependencies will shift automatically when you make a change, so you don’t have to recreate the entire chart.
Regardless of where or how you create it, your Gantt chart allows you to get a grasp on all sorts of important project information in one look, including:
- The order that tasks need to be completed in
- How long each task will take
- Any overlap between tasks
- Task dependencies (indicated with an arrow)
- Who is responsible for each task an arrow)
- Who is responsible for each task
Put simply, a Gantt chart makes it easy to get an overview of all of the different tasks involved with your project, which means you can keep things running smoothly and avoid several common project management mistakes.
Why project management mistakes cause projects to fail
Projects rarely fail because teams lack effort or expertise. More often, they fail due to avoidable project management mistakes that compound over time. When goals aren’t clearly defined, timelines aren’t realistic, or dependencies aren’t understood, small issues quickly turn into missed deadlines, cost overruns, and frustrated teams.
Many of the most common project failures stem from a lack of visibility. Without a clear view of how tasks connect, who owns what, and how progress is tracking against the plan, project managers are forced to react rather than proactively course-correct. This makes it easy for risks to go unnoticed until they’ve already impacted delivery.
These mistakes are especially costly in complex projects that involve multiple teams, frequent handoffs, or tight deadlines. The good news is that most of them aren’t caused by poor execution; they’re caused by poor planning, outdated tools, or incorrect use of a Gantt chart.
Using an online Gantt chart helps eliminate blind spots by visualizing timelines, dependencies, and progress in one place, making it easier to spot issues early and keep projects on track while avoiding these five common mistakes:
- Weak or unclear project kickoffs
- Ignoring task dependencies
- Poorly coordinated project handoffs
- Siloed tasks and limited visibility
- Losing visibility into project progress
Project management mistake #1: Weak or unclear project kickoffs
The very beginning of your project is an incredibly important time. It’s when you get all of the key players and stakeholders on the same page about expectations, task deadlines, and project goals.
According to executive leaders, a lack of clear goals is the most common reason for project failure. Additionally, inaccurate time estimates are the cause of failure in up to 28% of projects.
Needless to say, you shouldn’t overlook the importance of your kickoff for ironing out these sorts of details. Otherwise, you run the risk of building your entire project on a shaky foundation.
However, when you’re eager to roll up your sleeves and get things moving, it’s tempting to skip over this crucial step and just get people started — without confirming that everybody is operating with the same understanding of how the project will run (and why it matters).
How to avoid weak or unclear project kickoffs with an online Gantt chart
Arguably, one of the most important pieces of your project is the timeline, as that trickles down and affects everything from your budget to your resource allocation.
While a Gantt chart isn’t quite a crystal ball, it forces you to take a step back and understand the overall schedule, the flow of various tasks, and the connection of different teams.
By mapping this out, you and all of your project players are able to get a bird’s-eye view and ensure that you’re starting with shared expectations.
Using Wrike’s Gantt chart, teams can build and share a kickoff-ready timeline that clearly defines goals, milestones, and ownership from day one. Because timelines update automatically as work changes, everyone stays aligned on expectations throughout the project, not just at kickoff.
Project management mistake #2: Ignoring task dependencies
Any project contains task dependencies — meaning that a certain task can’t be started until the previous one is completed.
Failing to identify these can lead to a nonsensical order of tasks (because you don’t understand how they’re related to one another) and a lack of accountability amongst team members (because they don’t understand how their own setbacks slow the entire project down).
As if that all wasn’t bad enough, this lack of understanding and these constant delays also inspire tons of frustration and confusion amongst your team.
How to avoid ignoring task dependencies with an online Gantt chart
A Gantt chart clearly illustrates dependencies between your tasks with an arrow, but it’s also incredibly helpful when using the critical path method (CPM), which requires that you understand:
- The tasks required to complete the project
- The dependencies between the tasks
- The estimated time (duration) that each task will take to complete
Wrike’s Gantt chart automatically maps task dependencies and highlights changes that impact the critical path. When a dependency shifts, Wrike adjusts downstream dates in real time, helping teams avoid cascading delays and respond before small issues become schedule risks.
All of this information is displayed directly on your Gantt chart. You can use your chart to identify the critical path (which is the longest stretch of dependent activities) and not only better understand how those tasks are connected, but also which ones leave some wiggle room for inevitable delays (without extending the duration of your entire project).
Project management mistake #3: Poorly coordinated project handoffs
Handoffs are another sticky spot when managing projects. Whether the project is being passed to another individual or to an entirely new team or department, it’s challenging to ensure the new task or project owner has the necessary information and context to complete their portion effectively.
Often, updates or changes aren’t communicated, and adequate background information isn’t provided, leaving the new task owner feeling as if they’re starting an entirely new project rather than contributing to something that’s already well underway.
How to avoid poorly coordinated project handoffs with an online Gantt chart
With a Gantt chart, you can visualize exactly when project handoffs will happen — between people, teams, and departments. Knowing when these will occur means that you can anticipate them (rather than scrambling at the last minute) and iron out a process for facilitating a more seamless handoff by doing things like:
- Standardizing some sort of creative brief or questionnaire that people must fill out in order to transfer the necessary knowledge to the new owner
- Instituting a checklist that individuals or teams must complete before handing off the project
In short, you can’t facilitate smooth handoffs if you don’t know when they’ll happen, and a Gantt chart is crucial for understanding exactly where these hurdles occur. In Wrike, handoffs are tied directly to tasks, owners, and timelines, so context doesn’t get lost between teams. Comments, attachments, and task histories stay connected to each handoff, giving the next owner everything they need without searching through emails or separate documents.
Project management mistake #4: Siloed tasks and limited visibility
It’s easy for work to become siloed, particularly when your project involves a lot of different tasks and teams. For example, the graphic design team probably has no idea what the content team is working on, and vice versa.
Groups and team members can become so intensely focused on their individual assignments and deadlines, they forget how they connect to the larger picture.
What’s the problem? That decreased visibility into the entire project can contribute to:
- Miscommunication: Team members don’t understand how changes on their end impact the work of other teams.
- Delays: Work might need to be changed or redone because important information was missed, or because team members don’t understand that missing a single task deadline can delay subsequent tasks.
How to avoid siloed tasks and limited visibility with an online Gantt chart
Your Gantt chart essentially serves as your roadmap for the entire project. Team members can refer to it to understand how their own tasks fit into the overall project. What’s happening before the project is on their plates? What about after? Or concurrently with their own work?
Your Gantt chart also clearly illustrates what happens if a department or team member drops the ball or misses a deadline, as it will delay any dependent tasks that follow. A Gantt chart quite literally resembles a row of dominoes, so it’s effective at instilling an increased sense of accountability across your team.
Wrike’s shared Gantt charts give every team a real-time view of how their work fits into the larger project. By combining timelines with task ownership and cross-team visibility, Wrike helps teams understand dependencies, anticipate impacts, and stay accountable beyond their individual task lists.
Project management mistake #5: Losing visibility into project progress
Project managers often focus on ensuring that a specific task is completed correctly or meets its deadline, making it difficult to keep a close enough eye on all the other moving pieces involved in that project. This lack of visibility can cause tasks like a regular project management status report to fall by the wayside as visibility into project progress is lost.
Sure, that one task that you were closely monitoring might be completed on schedule, but the rest of the project might have fallen behind while you had your back turned.
How to avoid losing visibility into project progress with an online Gantt chart
A Gantt chart not only provides your team with increased visibility, but also you. You can quickly point to an individual task on your chart and get an immediate sense of where you are in the project’s overall process, as well as what other work should be happening right now.
No more digging through calendars, comments, or files to understand how the whole project fits together. Your Gantt chart does all of that legwork for you.
Wrike pairs Gantt charts with real-time dashboards and progress tracking tools, giving project managers instant visibility into what’s on track, what’s at risk, and what needs attention. Instead of chasing updates, managers can monitor progress in one place and make informed adjustments as work unfolds.
Avoid project management mistakes with Wrike’s online Gantt charts
Most project management mistakes stem from poor visibility, not poor execution. When teams can’t clearly see timelines, dependencies, and progress, small issues quickly turn into missed deadlines.
Online Gantt charts help prevent this by giving teams a shared, real-time view of how work fits together. Instead of reacting to problems late, project managers can spot risks early and keep projects moving forward.
Wrike’s online Gantt charts make this easier by automatically updating timelines and dependencies as work changes. Combined with real-time dashboards and collaboration tools, Wrike helps teams turn plans into action and avoid common project management mistakes without added complexity.
Ready to get started? Sign up for a 14-day free trial of Wrike, and experience the power of Gantt charts for yourself.

Project management mistakes to avoid — FAQs
What are the most common project management mistakes?
The most common project management mistakes include unclear project goals, weak project kickoffs, missed task dependencies, poor communication during handoffs, siloed work, and losing visibility into overall progress. These issues often lead to delays, rework, and misaligned expectations across teams.
How can Gantt charts help in project management?
Gantt charts help in project management by visualizing tasks, timelines, dependencies, and ownership in one place. They give project managers a clear overview of how work fits together, making it easier to plan schedules, coordinate teams, and adjust timelines when changes occur.
What mistakes do Gantt charts prevent?
Gantt charts help prevent common mistakes such as missed dependencies, unrealistic timelines, poor handoff coordination, and a lack of visibility into project progress. By showing how tasks connect and when work should happen, Gantt charts reduce confusion and improve accountability.
Are Gantt charts good for complex projects?
Yes, Gantt charts are especially useful for complex projects with multiple tasks, dependencies, and teams. They help break down large initiatives into manageable pieces and make it easier to track progress, identify risks, and coordinate work across different contributors.
What are common mistakes in Gantt charts?
Common Gantt chart mistakes include creating overly detailed task lists, failing to update timelines when changes occur, ignoring task dependencies, and using static charts that don’t reflect real-time progress. These issues can make Gantt charts hard to maintain and reduce their effectiveness.
What’s the difference between online and Excel Gantt charts?
Online Gantt charts update automatically when tasks, dates, or dependencies change, while Excel Gantt charts require manual updates. Online tools also support collaboration, real-time visibility, and dependency management, making them more reliable for managing active projects than static spreadsheets.