
Boost Visibility with the Best Project Tracking Software
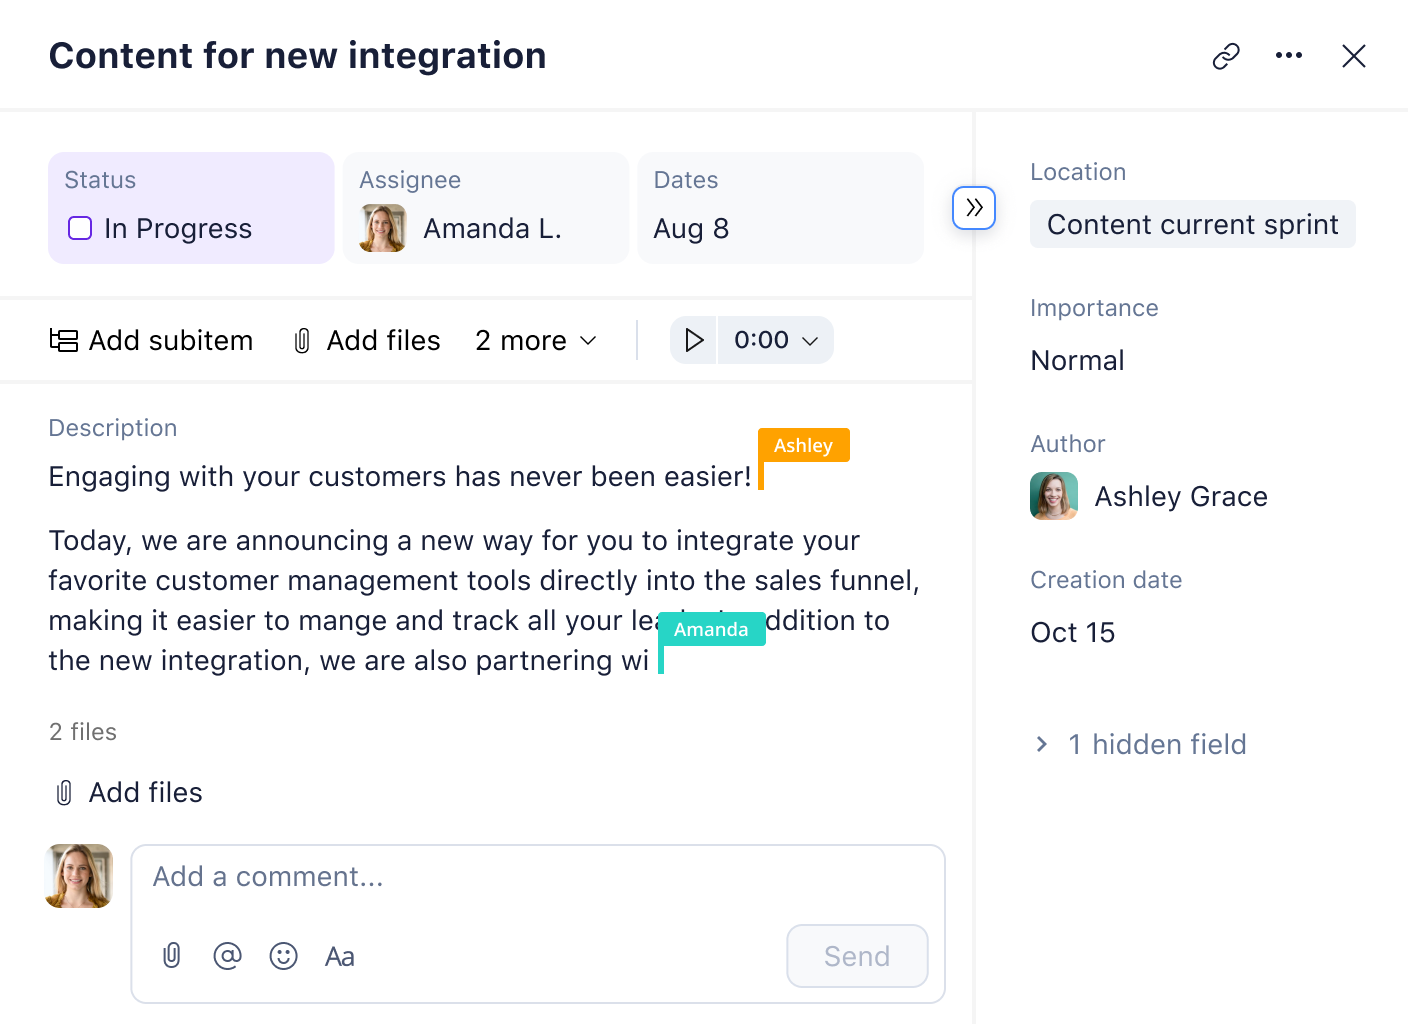
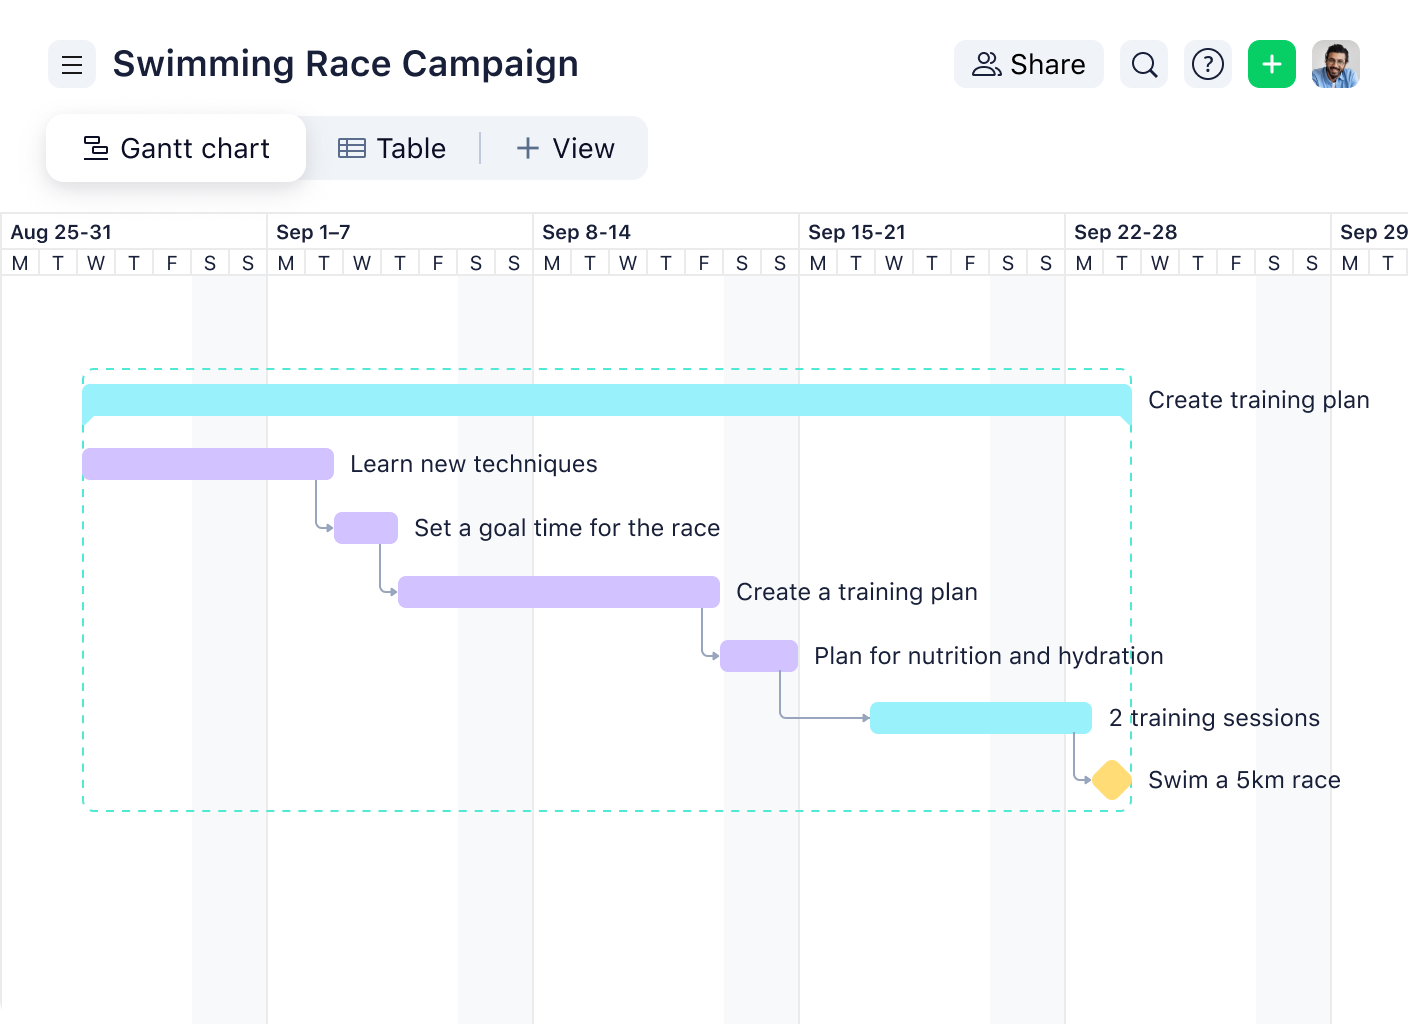
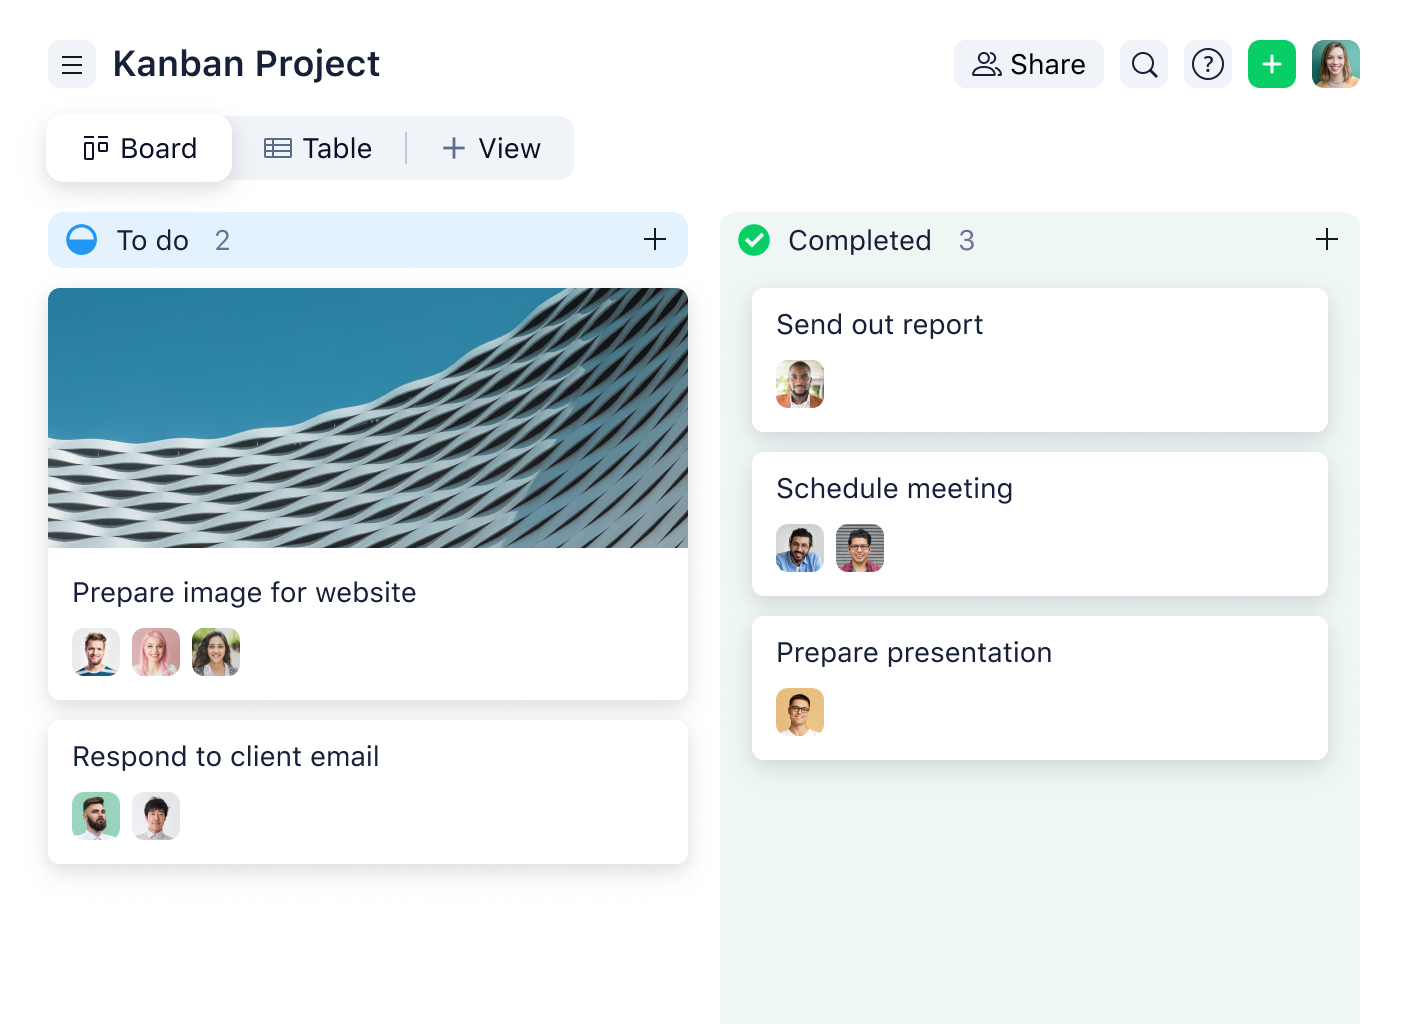
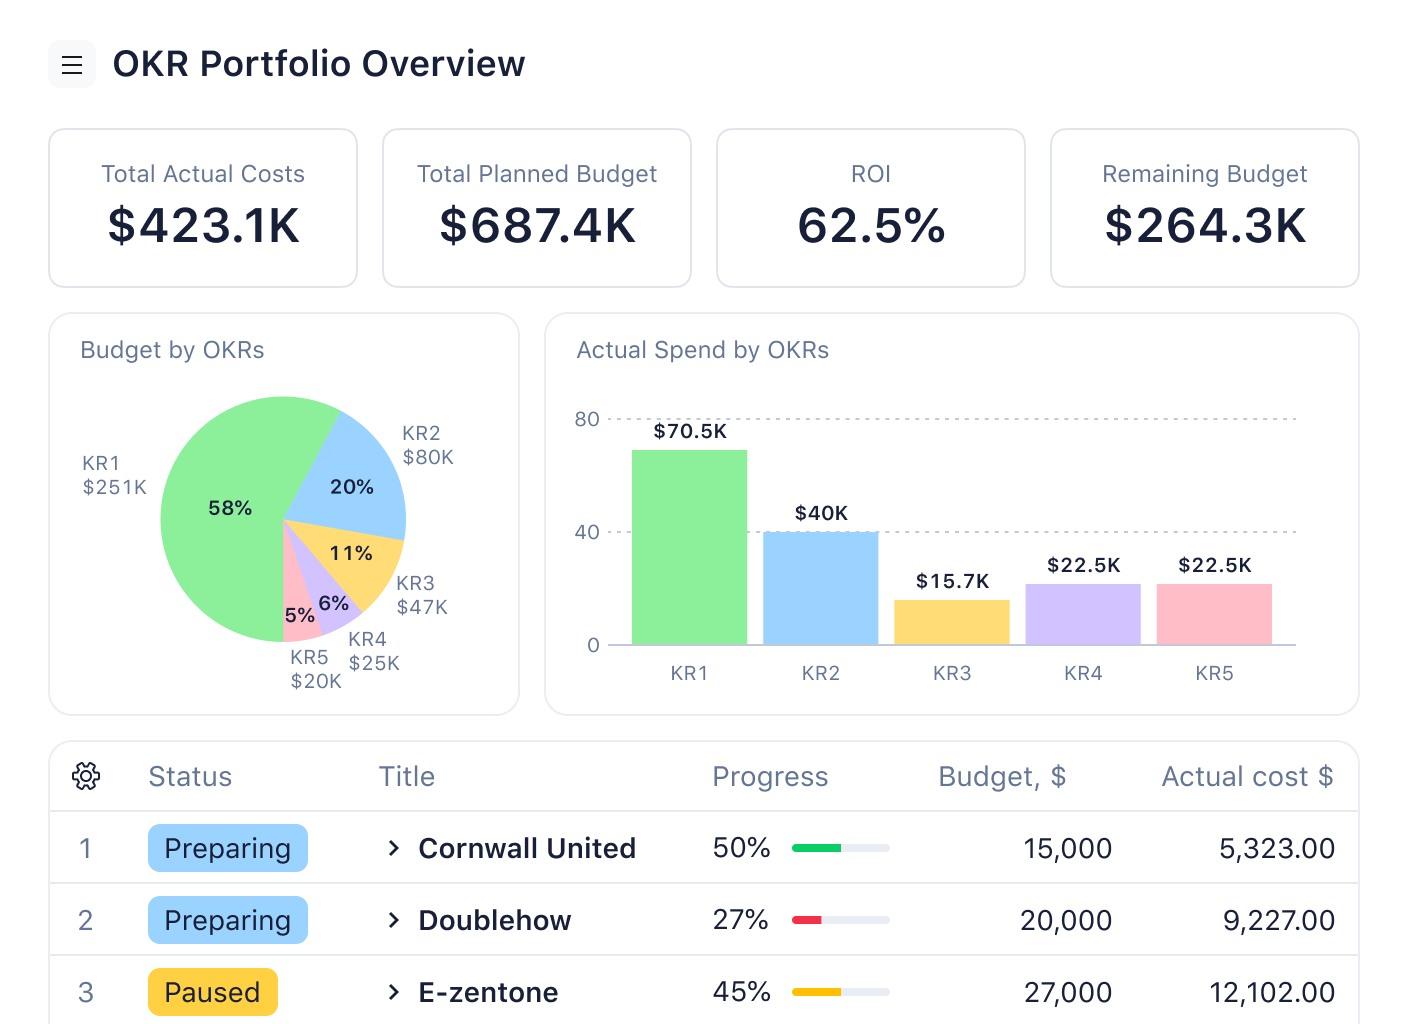
With Wrike’s project tracking software, you can monitor team progress and identify potential roadblocks in real-time.


“With Wrike, I am able to track and monitor all of my projects in one place. If asked about one of my projects, I can instantly go into Wrike and give them an update within 30 seconds.”

“Templates permit us to work in parallel with the mountain of requests that you could never cope with if you weren’t using a tool like Wrike.”
“Projects that had taken nine months to complete now take 16 weeks. Today, we can manage 250% more projects, which means we can be more responsive, increasing customer satisfaction.”

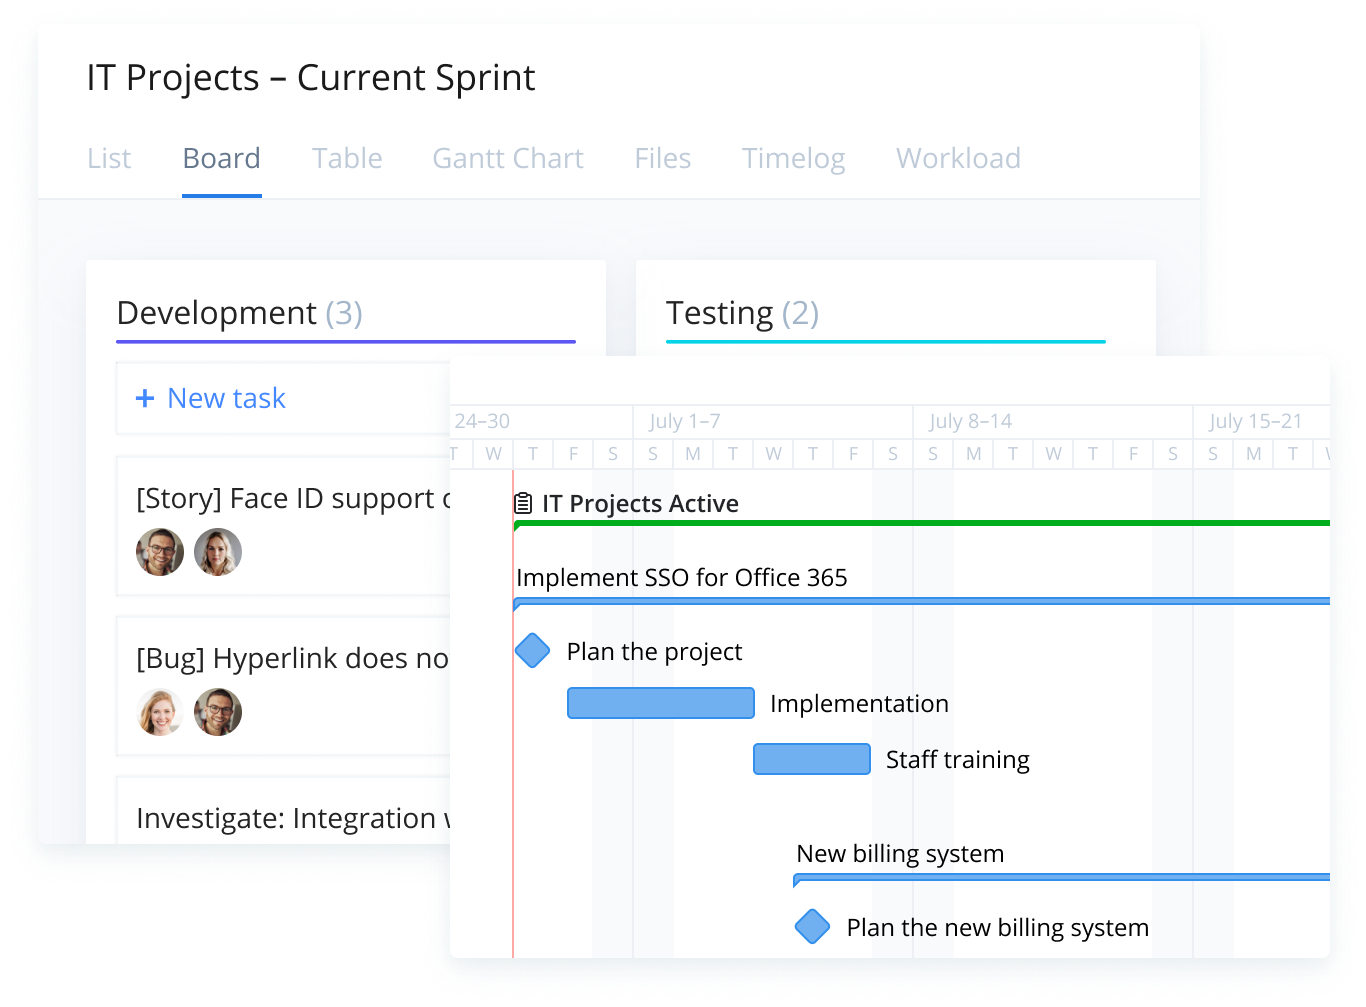
How to track projects with Wrike


![]()