As a project manager, you need the right tools to help you organize project plans, streamline tasks, and maximize efficiencies for on-time and on-budget delivery. Gantt charts and PERT charts both meet those criteria. In this post, we’ll dig deeper into what makes these two tools so useful for PMs, when each chart is best utilized, and how you can use them both to plan and monitor your projects for the most successful outcomes possible.
Gantt charts vs. PERT charts
Both Gantt charts and PERT charts are tools to help visualize projects from beginning to end, along with the individual tasks associated with them. The key difference between the two charts is how they present project data.


A Gantt chart is a bar chart that lays out project tasks and timelines linearly. The y-axis is made up of individual tasks and the x-axis represents time. Gantt charts are great for improving efficiencies and optimizing time management, as PMs can adjust tasks in the chart as the project progresses to keep it on track for a timely delivery.
A PERT chart, on the other hand, is structured as a flow chart or network diagram that displays all the project tasks in separate boxes and connects them with arrows to show task dependencies clearly. Although a PERT — short for Program Evaluation and Review Technique — chart doesn’t have dates along the x-axis like a Gantt chart, the individual boxes that make up PERT charts identify the time needed to complete each task.
What is a PERT chart used for?
The PERT methodology was developed in the 1950s by the U.S. Navy to help manage large, complex projects. With a PERT chart, project managers can define all tasks and activities required for the project, then develop a realistic timeframe for project completion. PERT charts are also useful in scheduling and coordinating team members to accomplish the project’s tasks.
What is a Gantt chart used for?
A Gantt chart, named for Henry Gantt who developed the tool back in 1910, displays every task required by a given project linearly. This timeline view makes it easy to see exactly how long each task (and the overall project) is expected to take. Gantt charts are also great for visualizing the order of specific tasks, as well as the teams and individuals responsible for each task.
What is the advantage of a PERT chart?
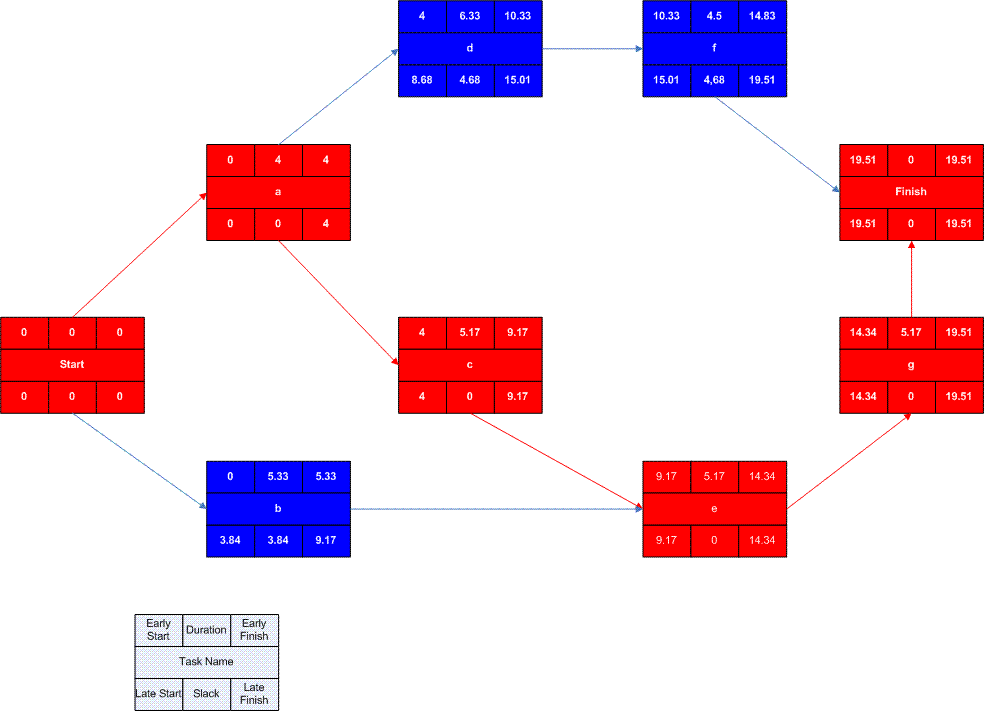
Typically, a PERT chart is advantageous at the outset of a project’s planning phase to get a high-level overview of all the tasks involved, their dependencies, and estimated completion dates. Because it is laid out like a flow chart, with each task pointing directly to the next sequential task (or tasks), a PERT chart provides an excellent visual representation of the relationship between each project activity.
On the downside, PERT charts can quickly become complicated and even confusing when used for large, complex projects with hundreds of individual tasks.
What is the advantage of a Gantt chart?

Gantt charts are usually the better option for monitoring projects once they’re underway. Gantt charts provide project transparency to team members and stakeholders and clearly represent task and project timelines. With a Gantt chart, PMs can quickly identify whether a project is progressing as scheduled and know precisely where each task should be at any given point during the project cycle.
The disadvantage of a Gantt chart is the time it can take to create and update. However, with modern software, you can easily make and manage Gantt charts to help monitor your projects.
PERT vs Gantt: Which one is right for me?
Because of the unique ways in which Gantt and PERT charts visually represent project tasks and life cycles, they both have their place in the project manager’s toolkit. With Wrike, you can easily make and modify both charts to help you optimize planning and time management throughout the entire project cycle.
Wrike enables project managers to:
- Simplify project planning, prioritize scheduling, and efficiently assign tasks
- Create custom workflows and automatically assign the right work to the right person in the right order
- Forget about the PERT vs. Gantt debate and easily utilize both tools for maximum efficiency
Manage projects with Wrike's Gantt charts
Looking for an easy way to create and monitor projects with a Gantt chart? Wrike's online Gantt charts give you a bird's-eye view of project progress and task dependencies. Just drag and drop tasks to adjust project schedules — our dynamic timelines will automatically update other tasks accordingly and notify your team of the changes.
Ready to see just how easy project planning and monitoring can be? Start your free two-week Wrike trial today!
Get things done faster with Wrike!
Wrike is a highly flexible collaboration and project management solution for teams of all sizes.