Wrike logo
    • Para equipos

      • Marketing

        Optimiza las revisiones y los informes para campañas perfectas.

      • Servicios profesionales

        Controla las horas facturables y aumenta la satisfacción del cliente.

      • Creatividad y diseño

        Crea recursos de alta calidad y consigue su aprobación en tiempo récord.

      • Ver todos los equipos

    • Casos prácticos

      • Gestión de proyectos

        Planifica proyectos Agile, controla los plazos y genera resultados.

      • Gestión de recursos

        Consulta la carga laboral y reasigna tareas para evitar el desgaste.

      • Gestión de proyectos empresariales

        Prepara tu empresa para todo.

      • Gestión de proyectos Agile

        Entrega tus proyectos con velocidad y agilidad.

      • Ver todos los casos prácticos

    • Explora Wrike

      • Haz una demo del producto

      • Solicita una demo

      • Historias de clientes

      • Empieza con plantillas

    • Funciones

      • Paneles de control de proyectos

        Impulsar decisiones mejores, más rápidas y basadas en datos con análisis potentes.

      • IA

        Aprende sobre IA y automatizaciones potentes con Work Intelligence® de Wrike.

      • Diagramas de Gantt

        Programación interactiva de proyectos entre equipos.

      • Automatización

        Definir y activar flujos de trabajo automatizados para eliminar los esfuerzos manuales.

      • Revisión

        Revisión optimizada y colaboración en un solo lugar.

      • Tableros Kanban

        Vea al instante el progreso del proyecto y cree flujos de trabajo personalizados.

      • Formularios de solicitud dinámicos

        Formularios a medida con lógica condicional.

      • Seguimiento del tiempo

        Registre las horas de trabajo, cree hojas de tiempo y mejore la visibilidad.

      • Calendario de proyectos del equipo

        Domine las cronogramas con el calendario online de Wrike.

      • Ver todas las funciones

    • Plataforma

      • Solicita una demo

      • Empieza con plantillas

      • Wrike IA

      • Integraciones

      • Aplicaciones móviles y de escritorio

    • Aprende y conéctate

      • Recursos

        Los principales recursos de productividad, colaboración y más.

      • Blog de Wrike

        Las últimas novedades y mejores prácticas sobre la gestión de proyectos.

      • Guías formativas

        Guías y herramientas para gestionar mejor tu trabajo.

      • Webinars

        Participa en nuestras sesiones en directo o a petición para hacer mejor tu trabajo.

    • Conviértete en experto en Wrike

      • Centro de soporte

      • Paquetes de asistencia

      • Servicios profesionales de Wrike

  • Enterprise
  • Precios
Contáctanos
    Language selector dropdown with globe icon and list of available languages.
    English
    Dansk
    Deutsch
    Español
    Français
    Bahasa Indonesia
    Italiano
    Bahasa Melayu
    Nederlands
    Norsk
    Polski
    Português (BR)
    Svenska
    Русский
    日本語
    한국어
    中文 (简体)
    中文 (繁體)
Iniciar sesión
Wrike logo
Wrike logo
  • Descripción general de la guía
    • Fundamentos de la gestión de proyectos
      • ¿Qué es un proyecto?
      • ¿Qué es la gestión de proyectos?
      • ¿Cuáles son las etapas de un proyecto?
      • Importancia de la gestión de proyectos
      • ¿Qué hace un gestor de proyectos?
      • Especialización en gerencia de proyectos
    • Metodologías de gestión de proyectos
      • A. Metodologías secuenciales tradicionales
      • B. Metodologías Agile
      • C. Metodologías de gestión del cambio
      • D. Metodologías basadas en el proceso
      • E. Otras metodologías
      • F. El método PMBOK
    • Ciclo de vida de un proyecto
      • Fase de inicio de un proyecto
      • Fase de planificación
      • Fase de ejecución
      • Fase de seguimiento de un proyecto
      • Cierre de proyecto
      • Cierre de proyecto
    • Software de gestión de proyectos
    • Consejos para el trabajo en equipo
      • Importancia del trabajo colaborativo en la gestión de proyectos
      • Cómo crear un equipo de trabajo para el proyecto
      • Cómo lograr un equipo de trabajo para el éxito
      • Haz que la reunión inicial sea fructífera
      • Consejos para una eficiente gestión de equipos
      • Cómo crear un entorno de trabajo colaborativo
      • Consejos y técnicas de gestión de proyectos
      • Consejos para un trabajo en equipo remoto y reuniones virtuales
    • Fundamentos de la metodología Agile
      • ¿Qué es la metodología Agile?
      • Historia de la metodología Agile
      • Los 12 principios Agile
      • Ventajas de la gestión de proyectos Agile
      • Cuándo no usar el método de gestión de proyectos Agile
      • Agile vs. Scrum
      • Gestión de proyectos con metodología Agile vs Cascada
      • Recursos adicionales del método Agile
    • Herramientas y técnicas de gestión de proyectos Agile
      • Consejos de gestión del cambio para implementar Agile en un entorno de cascada
      • Los 5 mejores libros sobre Agile
      • Cómo escoger la mejor herramienta Agile para la gestión de proyectos
      • Cómo crear tu primer plan de proyecto y flujo de trabajo Agile
      • Más que una metodología: cómo crear un entorno Agile
    • Marcos de gestión de proyectos
      • A. ¿Qué es un marco o método de gestión de proyectos?
      • B. ¿Qué tienen en común los distintos marcos Agile?
      • C. El marco Scrum
      • D. Otros métodos populares de gestión de proyectos Agile
      • E. Definición de épica Agile
      • F. Buenas prácticas del gestor de proyectos para escoger el marco adecuado
      • G. Herramientas gratuitas para la gestión de proyectos Agile
    • Recursos
      • Especialización en gerencia de proyectos
      • Libros sobre gestión de proyectos
      • Inspiración para el liderazgo
    • Glosario
    • Preguntas frecuentes
      • Desarrollo profesional
      • Herramientas
      • Metodologías
      • PM Software Features
      • PMI
      • Terminología avanzada
      • Terminología básica
    1. Inicio
    2. Guía de gestión de proyectos
    3. FAQ
    4. Terminología avanzada

    ¿Qué es un diagrama de Gantt en gestión de proyectos?

    1 MIN LEÍDOS
    Artem Gurnov
    Artem Gurnov Director de desarrollo de cuentas, Wrike

    ¿Qué es un diagrama de Gantt en gestión de proyectos?

    Un diagrama de Gantt es una tabla que ilustra la trayectoria de un proyecto y todos los elementos involucrados. Fue diseñado por primera vez por Karol Adamiecki en 1896. Más tarde, en la década de 1910, Henry Gantt concibió su propia versión que ilustra un cronograma de proyecto. Los diagramas de Gantt son una herramienta útil para ver el panorama completo de uno o varios proyectos. Permiten ver qué tareas son dependientes unas de otras y qué hitos se pueden alcanzar.

    Wrike project management Gantt chart showing tasks and colored timeline bars.

    A Gantt chart can look very different depending on your project methodology — for example, a traditional Waterfall-style Gantt chart lays out tasks in a fixed sequence, while a Gantt chart adapted for Agile methodology may reflect sprints, iterative deliverables, and flexible timelines. Regardless of methodology, the core purpose remains the same: to provide a visual timeline that maps tasks, durations, dependencies, and milestones so teams have a shared schedule and clear visibility into work progress.

    In this guide, you will learn what a Gantt chart is, what it includes, when to use one, and how to build and manage Gantt charts effectively with modern project management tools.

    Key takeaways

    • A Gantt chart is a timeline-based project management tool that visually maps tasks, durations, dependencies, and milestones.
    • It improves planning and coordination by showing how work is sequenced, who is responsible, and where risks or bottlenecks may occur.
    • Key components include task lists, timelines, task bars, progress indicators, and resource assignments.
    • Gantt charts are especially valuable for complex, multi-phase projects that require clear visibility and cross-team alignment.
    • Modern tools like Wrike enhance Gantt charts with real-time updates, automated scheduling, collaboration features, and resource management.

    What is a Gantt chart?

    In project management, a Gantt chart is a graphical schedule that maps project activities against time. Along the left, you see a list of tasks or work packages. Along the top, you see a time scale, such as days, weeks, or months. Each task appears as a bar that stretches from its planned start date to its planned end date.

    A Gantt chart helps you answer questions like:

    • What work needs to be done and in what order?
    • When does each task start and finish?
    • Which tasks depend on others finishing first?
    • Who is responsible for each part of the project?

    By putting all of this in one timeline view, a Gantt chart gives you a single source of truth for planning and tracking your project.

    Why Gantt charts matter in project management

    Gantt charts help project managers:

    • Visualize the entire project schedule at a glance
    • Understand how tasks connect and where dependencies exist
    • Spot potential bottlenecks before they cause delays
    • Communicate timelines clearly to stakeholders
    • Track progress against the plan

    Tools like Wrike enhance these benefits by keeping timelines updated in real time and visible to everyone involved. Unlike simple task lists or calendars, Gantt charts show both the sequence of work and the duration of each task, making them a powerful tool for managing complex initiatives with many moving parts.

    Key components of a Gantt chart

    A Gantt chart with the title “City Hall Project” and 7 horizontal bars with the terms “Business Need”, “High-level Requirements”, “Objectives”, “Project Team”, “Risk Assessment”, “Scope”, and “Success Criteria” listedA Gantt chart with the title “City Hall Project” and 7 horizontal bars with the terms “Business Need”, “High-level Requirements”, “Objectives”, “Project Team”, “Risk Assessment”, “Scope”, and “Success Criteria” listed

    A useful Gantt chart in project management usually includes:

    • Task list
    • Time scale
    • Task bars
    • Dependencies
    • Milestones
    • Progress indicators
    • Owners and resources

    Task list

    A structured list of tasks, subtasks, or work packages that make up the full scope of the project. This list often reflects the work breakdown structure (WBS) and may be grouped into phases, deliverables, or milestones. It forms the backbone of the Gantt chart because every visual element on the timeline corresponds to an item in this list.

    Time scale

    A horizontal calendar running along the top of the Gantt chart. It can display days, weeks, months, or even quarters depending on the length and complexity of your project. The time scale helps you quickly see how long tasks will take and how work stretches across the overall timeline.

    Task bars

    Horizontal bars that visually represent the planned duration of each task. The bar’s placement shows the start and end dates, while its length shows the expected amount of time needed to complete the work. Task bars make it easy to understand the project at a glance without digging into detailed schedules.

    Dependencies

    Arrows or connecting lines showing how tasks relate to each other. For example, one task might need to finish before another can begin (finish-to-start), or two tasks may need to run at the same time. Mapping dependencies helps you understand how delays can affect downstream work and is essential for accurate project planning.

    In modern tools such as Wrike, dependencies automatically adjust when timelines change, helping teams avoid cascading delays.

    Milestones

    Significant points in the project schedule, often marked by diamonds or distinctive symbols. Milestones represent major achievements such as approvals, phase completions, product launches, or client review dates. They act as anchors for measuring progress and ensuring the project stays aligned with critical deadlines.

    Progress indicators

    Visual cues showing how much work has been completed. These may include shaded portions of task bars, percentage-complete labels, or color changes. Progress indicators allow project managers and stakeholders to quickly compare planned timelines against actual performance.

    Owners and resources

    Labels, initials, or icons that identify who is responsible for each task, making accountability clear throughout the project. Some Gantt charts also include resource allocation details such as hours assigned or workload levels. This helps teams avoid overbooking individuals and ensures that tasks are distributed realistically across available resources.

    When to use a Gantt chart

    Gantt charts are especially helpful when:

    • Your project has many tasks, phases, or dependencies
    • You need to coordinate work across multiple teams or functions
    • Stakeholders want a clear visual of timelines and milestones
    • You must manage critical deadlines, such as product launches or campaign dates

    Examples include software releases, marketing campaigns, construction projects, event planning, and cross-functional initiatives. For small, simple efforts, a basic task list may be enough, but as complexity grows, a Gantt chart becomes much more useful. With software like Wrike, teams can scale Gantt charts from simple timelines to complex, cross-functional project plans as needs evolve.

    Who uses Gantt charts?

    Gantt charts are widely used across industries because they make it easier to plan work, manage dependencies, and keep teams aligned. Any team that needs clear timelines and structured project visibility can benefit from them, but they’re especially common in fields where scheduling and coordination are critical.

    Industries that rely heavily on Gantt charts include:

    • Construction and engineering: To sequence tasks, manage contractors, and track milestones for large builds
    • Software development: For mapping releases, tracking dependencies, and coordinating cross-functional teams
    • Marketing and creative teams: To plan campaigns, content calendars, and multi-phase deliverables
    • Manufacturing and product development: To manage production timelines, testing cycles, and launch plans
    • Event management: To coordinate vendors, deadlines, and logistics leading up to event day

    These charts help teams visualize how work moves from start to finish, making them useful for anything from small team projects to enterprise-level initiatives.

    Benefits of Gantt charts for project management

    Gantt charts bring structure, visibility, and predictability to project planning and execution. By laying out tasks across a timeline and showing how work connects, they help teams stay organized and avoid surprises. When supported by modern project management software such as Wrike, these benefits extend beyond planning into day-to-day execution. Key benefits include:

    • Clarity
    • Alignment
    • Risk visibility
    • Better coordination
    • Accountability

    Clarity

    A Gantt chart consolidates all tasks, dates, and milestones into one visual timeline. This makes it easy for teams and stakeholders to understand the project’s overall plan without digging through spreadsheets or documents.

    Alignment

    Because a Gantt chart shows who is responsible for which tasks and when those tasks are scheduled, everyone understands their role in the project. This reduces miscommunication and helps ensure all contributors are working toward the same goals.

    Risk visibility

    Dependencies help teams see where delays might impact other tasks. If one activity starts slipping, the Gantt chart makes it clear which downstream work may also be affected, giving project managers time to adjust before problems escalate.

    Better coordination

    With tasks assigned to individuals or teams along the timeline, Gantt charts simplify resource planning. Teams can spot bottlenecks, identify periods of overload, and adjust assignments to keep work moving smoothly.

    Accountability

    Each task bar shows who owns the work and when it must be completed. This transparency helps reinforce responsibility and keeps the team on track, especially on long or complex projects.

    How teams use Gantt charts in modern project environments

    Gantt charts have been a foundational project management tool for over a century, but today’s digital project environments have transformed how teams use them. 

    Modern work moves faster, involves more stakeholders, and often requires coordinating multiple tools or methodologies. Contemporary Gantt chart software adapts to these needs by offering capabilities that go far beyond basic timelines, including:

    • Real-time progress tracking
    • Automated scheduling updates
    • Resource load balancing
    • Collaboration tools and shared visibility
    • Integration with Agile or hybrid workflows

    Real-time progress tracking

    Modern Gantt charts update instantly as tasks are completed or adjusted. This helps teams spot delays early, understand how changes affect the broader schedule, and maintain an accurate project view without manual updates.

    Automated scheduling updates

    When one task shifts, connected dependencies automatically adjust. This reduces guesswork, eliminates outdated timelines, and prevents scheduling conflicts — all benefits that are especially useful in complex or multi-phase projects.

    Resource load balancing

    Contemporary tools allow project managers to see resource availability directly on the timeline. This helps prevent over-allocation, identify gaps, and ensure work is assigned realistically based on team capacity.

    Collaboration tools and shared visibility

    Where early Gantt charts were static, modern versions support comments, file attachments, and shared access. Cross-functional teams can communicate in context, track updates, and keep stakeholders aligned without the need for endless meetings or email threads.

    Integration with Agile or hybrid workflows

    Gantt charts are no longer just for traditional Waterfall projects. Many teams blend them with Agile methods, using timeline views alongside Kanban boards, sprint planning tools, and backlog management. This hybrid approach provides both flexibility and long-range visibility.

    Experience better project clarity with Wrike

    A well-built Gantt chart gives teams the structure, visibility, and confidence they need to deliver projects on time. With Wrike’s dynamic Gantt chart view, automated scheduling updates, real-time collaboration tools, and resource management features, you can move from static timelines to a truly connected project workflow. Whether you’re coordinating simple tasks or managing complex cross-team initiatives, Wrike makes planning clearer, execution smoother, and adaptability effortless.

    Start your free trial today and see how Wrike transforms Gantt charts into a powerful engine for project success.

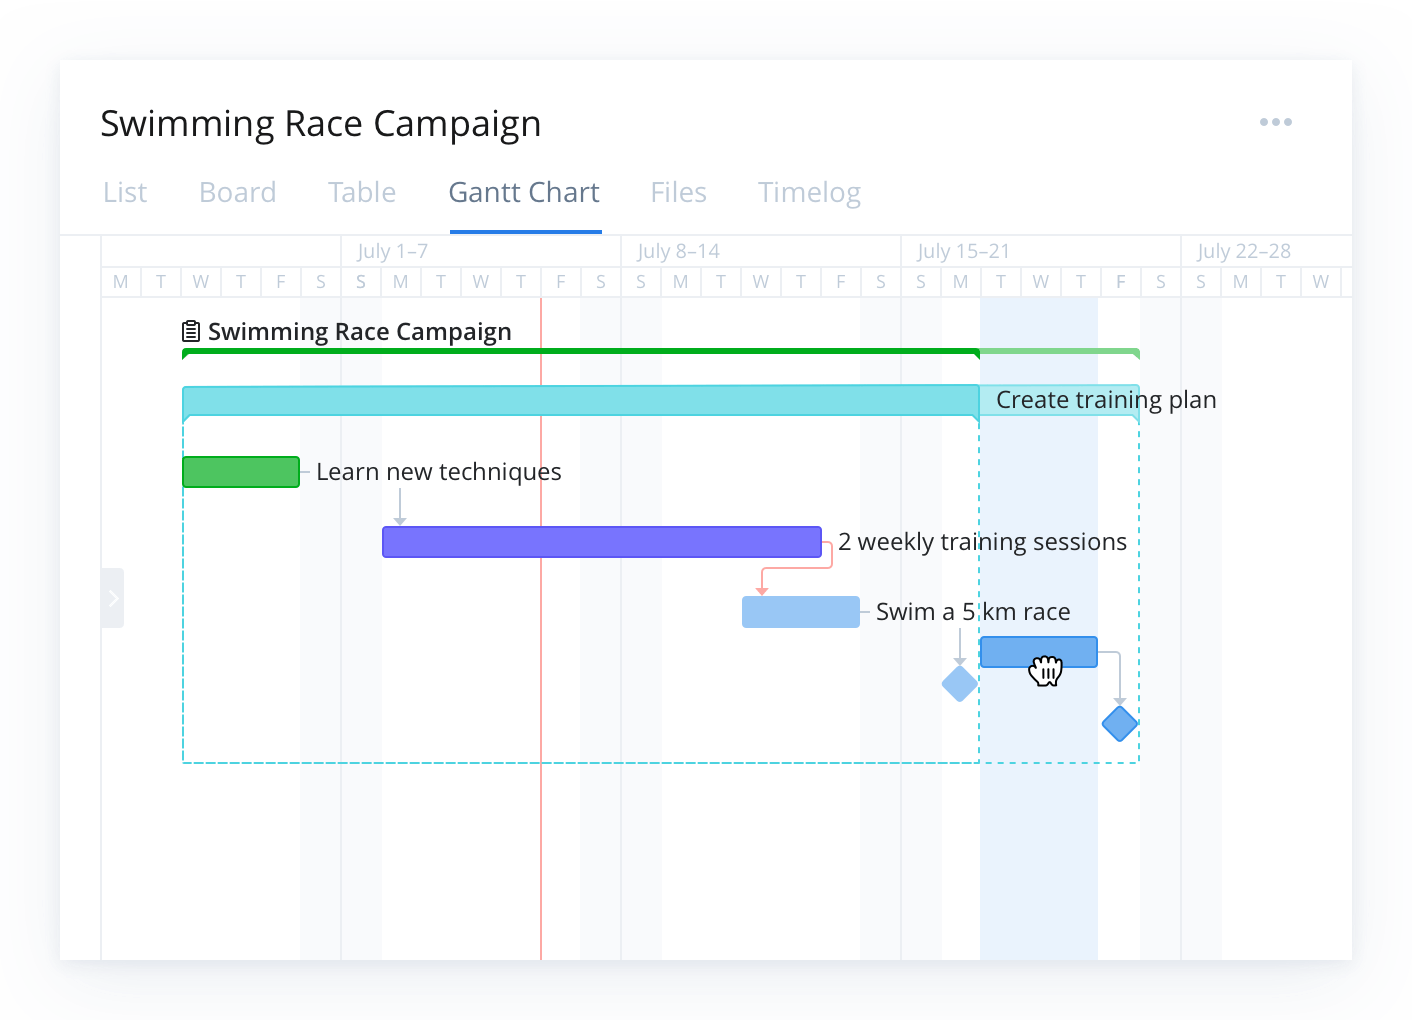
    Por tanto, ¿qué es un diagrama de Gantt en gestión de proyectos? Sencillamente es una vista de la cronología de tus próximas tareas y fechas límites.

    Lecturas adicionales:

    • Guía para principiantes sobre los diagramas de Gantt


    Terminología avanzada 5 preguntas
    ¿Qué es la gestión de cambios en gestión de proyectos? ¿Qué es el control de costes en gestión de proyectos? ¿Qué es la gestión de costes en gestión de proyectos? ¿Qué es un diagrama de Gantt en gestión de proyectos? ¿Qué es PERT en gestión de proyectos?
    • Producto
      • Recorrido por el producto
      • Precios
      • Plantillas
      • Aplicaciones e integraciones
      • Gestión de tareas
      • Diagramas de Gantt
      • Estado de Wrike
      • Seguridad
      • Wrike API
      • Funciones
    • Soluciones
      • Enterprise
      • Marketing
      • Creativo
      • Gestión de proyectos
      • Desarrollo de producto
      • Operaciones empresariales
      • Servicios profesionales
      • Estudiantes
      • Todos los equipos
    • Recursos
      • Portal de ayuda
      • Comunidad
      • Blog
      • Webinars
      • Formación interactiva
      • Asistencia
      • Herramientas de gestión de proyectos con Google
      • Aviso sobre recopilación de datos según la CCPA
    • Empresa
      • Quiénes somos
      • Empleo
      • Nuestros clientes
      • Eventos
      • Sala de prensa
      • Partner Program
      • Conferencia de usuarios
      • Contacta con nosotros
    • Guías
      • Guía gestión de proyecto
      • Guía de servicios profesionales
      • Guía de Kanban (EN)
      • Guía de Agile (EN)
      • Guía de tablas Scrum (EN)
      • Guía de gestión de proyectos de marketing
      • Guía de gestión del trabajo colaborativo (EN)
      • Guía de marketing digital (EN)
      • Guía de comercialización (EN)
      • Guía de teletrabajo
      • Guía para la vuelta al trabajo (EN)
      • Guía de gestión de productos (EN)
    • Novedades del blog de Wrike
      • Cómo crear una retrospectiva visual con Wrike Whiteboard
      • ¿Qué es un entorno de marketing?
      • ¿Qué es el lead time o tiempo de entrega? (Definición, ejemplos y por qué es importante)
      • Cómo crear un plan de comunicación de proyecto: plantilla y ejemplos
      • ¿Cuál es la fórmula del tiempo de ciclo?
      • Teoría de los dos factores de Herzberg en la gestión de proyectos
      • Mapas Mentales: Guía paso a paso con ejemplos

    Suscríbete a las noticias y actualizaciones de Wrike

    Suscríbete a nuestros correos electrónicos de marketing para mantenerte al día con las últimas noticias y actualizaciones.

    AICPA logo.Footer icon BSI.Footer icon CSA star.

    Seguridad de nivel empresarial.
    Tiempo de actividad por encima del 99,9 %

    ©2006-2026 Wrike, Inc. Reservados todos los derechos. Patentado. Política de confidencialidad. Condiciones del servicio. Preferencias de cookies. Tus opciones de privacidad

    Wrike logo