Wrike logo
    • Für Teams

      • Marketing

        Proofing und Berichte optimieren für nahtlose Kampagnen.

      • Fachdienstleistungen

        Die Kontrolle über abrechenbare Stunden übernehmen und Kundenzufriedenheit steigern.

      • Design & Grafik

        Hochwertige Assets erstellen und in Rekordzeit freigeben lassen.

      • Alle Teams sehen

    • Anwendungsfälle

      • Projektmanagement

        Agile Projekte planen, Termine verfolgen, Ergebnisse liefern.

      • Ressourcenverwaltung

        Teamauslastungen ansehen und Aufgaben umverteilen, um Burnout zu vermeiden.

      • Enterprise-Projectmanagement

        Damit Ihr Unternehmen auf alles vorbereitet ist.

      • Agiles Projektmanagement

        Mehr leisten, schnell und agil.

      • Alle Anwendungsfälle sehen

    • Wrike entdecken

      • Eine Produkttour machen

      • Eine Demo buchen

      • ROI Berechner

      • Kundenerfahrungen

      • Mit Vorlagen beginnen

    • Funktionen

      • Projekt-Dashboards

        Bessere, schnellere, datengetriebene Entscheidungen mit leistungsstarken Analysen unterstützen.

      • KI

        Erfahren Sie mehr über leistungsstarke KI und Automatisierungen mit Wrikes Work Intelligence®.

      • Gantt-Diagramme

        Interaktive Projektplanung über Teams hinweg.

      • Arbeitsablauf-Automatisierung

        Definieren und auslösen Sie automatisierte Workflows, um manuelle Aufgaben zu eliminieren.

      • Proofing

        Effiziente Prüfung und Zusammenarbeit an einem Ort.

      • Kanban-Boards

        Sofortigen Projektfortschritt anzeigen und individuelle Workflows erstellen.

      • Dynamische Anfrageformulare

        Benutzerdefinierte Formulare mit bedingter Logik.

      • Zeiterfassung

        Arbeitsstunden erfassen, Stundenzettel erstellen und Transparenz verbessern.

      • Team-Projektkalender

        Verwalten Sie Projektzeitleisten mit Wrikes Online-Kalender.

      • Alle Funktionen anzeigen

    • Plattform

      • Eine Demo buchen

      • Mit Vorlagen beginnen

      • Wrike KI

      • Integrationen

      • Mobil- und Desktop-Apps

    • Erlernen und verbinden

      • Materialien

        Top-Assets zu Produktivität, Zusammenarbeit und mehr.

      • Wrike Blog

        Neueste Nachrichten und Best Practices zum Projektmanagement.

      • Schulungsleitfäden

        Leitfäden und Tools für besseres Arbeitsmanagement.

      • Webinare

        An unseren Live- oder On-Demand-Sitzungen teilnehmen, um beste Arbeit zu leisten.

    • Ein Wrike-Profi werden

      • Support-Drehscheibe

      • Wrike Support-Pakete

      • Wrike-Fachdienstleistungen

  • Enterprise
  • Preise
Vertrieb kontaktieren
    Language selector dropdown with globe icon and list of available languages.
    English
    Dansk
    Deutsch
    Español
    Français
    Bahasa Indonesia
    Italiano
    Bahasa Melayu
    Nederlands
    Norsk
    Polski
    Português (BR)
    Svenska
    Русский
    日本語
    한국어
    中文 (简体)
    中文 (繁體)
Anmelden
Wrike logo
Wrike logo
  • Leitfaden-Übersicht
    • Die Grundlagen des Projektmanagements
      • Wie wird ein Projekt definiert?
      • Was ist Projektmanagement?
      • Was sind die verschiedenen Phasen von Projektmanagement?
      • Warum ist Projektmanagement wichtig?
      • Was machen Projektmanager?
      • Projektmanagement-Zertifizierungen
    • Vorgehensmodelle von Projektmanagement
      • A. Die traditionellen, sequentiellen Vorgehensmodelle
      • B. Die agilen Vorgehensmodelle
      • C. Vorgehensmodelle von Change Management
      • D. Prozessbasierte Vorgehensmodelle
      • E. Andere Vorgehensmodelle
      • F. Das PMBOK-Vorgehensmodell
    • Der Projektlebenszyklus
      • Die Initialisierungsphase
      • Die Planungsphase
      • Die Ausführungsphase
      • Die Kontrollphase
      • Abschluss des Projekts
      • Abschluss des Projekts
    • Tipps für die Zusammenarbeit von Teams
      • Die Wichtigkeit von Zusammenarbeit im Projektmanagement
      • Wie stellt man ein Projektteam auf?
      • Was macht ein erfolgreiches Projektteam aus?
      • So wird das Projekt-Kick-off erfolgreich
      • Tipps für effektives Teammanagement
      • Wie schafft man eine kollaborative Arbeitsumgebung?
      • Tipps und Techniken rund um die Zusammenarbeit
      • Tipps für Remote-Zusammenarbeit und virtuelle Meetings
    • Die Grundlagen der Agilen Methode
      • Was ist die Agile Methode?
      • Die Geschichte der Agilen Methode
      • Die 12 Agile-Prinzipien
      • Die Vorteile von agilem Projektmanagement
      • Wann sollte man die agile Projektmanagement-Methode nicht anwenden?
      • Agile vs. Scrum
      • Agile vs. Wasserfallmodell
      • Weitere Ressourcen zum Thema Agile
    • Tools und Techniken des agilen Projektmanagements
      • Veränderungsmanagementtipps für die Implementierung von Agile in einer Wasserfallumgebung
      • Die 5 besten Bücher zum Thema Agile
      • Wie findet man das beste agile Projektmanagement-Tool?
      • Die Aufstellung Ihres ersten agilen Arbeitsflusses & Projektplans
      • Mehr als nur eine Methodik: Wie man eine agile Arbeitsumgebung erschafft
    • Projektmanagement-Rahmenwerke
      • A. Was ist ein Projektmanagement-Rahmenwerk?
      • B. Was haben agile Rahmenwerke gemeinsam?
      • C. Das Scrum-Rahmenwerk
      • D. Weitere beliebte agile Projektmanagement-Methoden
      • E. Definition Agile-Epics
      • F. Erfolgsmethoden für Projektmanager, um das richtige Rahmenwerk aufzustellen
      • G. Gratis agile Projektmanagement-Tools
    • Ressourcen
      • Projektmanagement-Training
      • Bücher rund um das Projektmanagement
      • Inspirationen für die Führung
    • Glossar
    • FAQ
      • Berufliche Weiterbildung
      • Erweiterte Begriffe
      • Grundlegende Begriffe
      • Methoden
      • PM Software Features
      • PMI
      • Tools
    1. Startseite
    2. Projektmanagement-Guide
    3. FAQ
    4. Erweiterte Begriffe

    Was ist ein Gantt-Diagramm im Projektmanagement?

    1 Min. Lesezeit
    Artem Gurnov
    Artem Gurnov Direktor für Account-Entwicklung, Wrike

    Was ist ein Gantt-Diagramm im Projektmanagement?

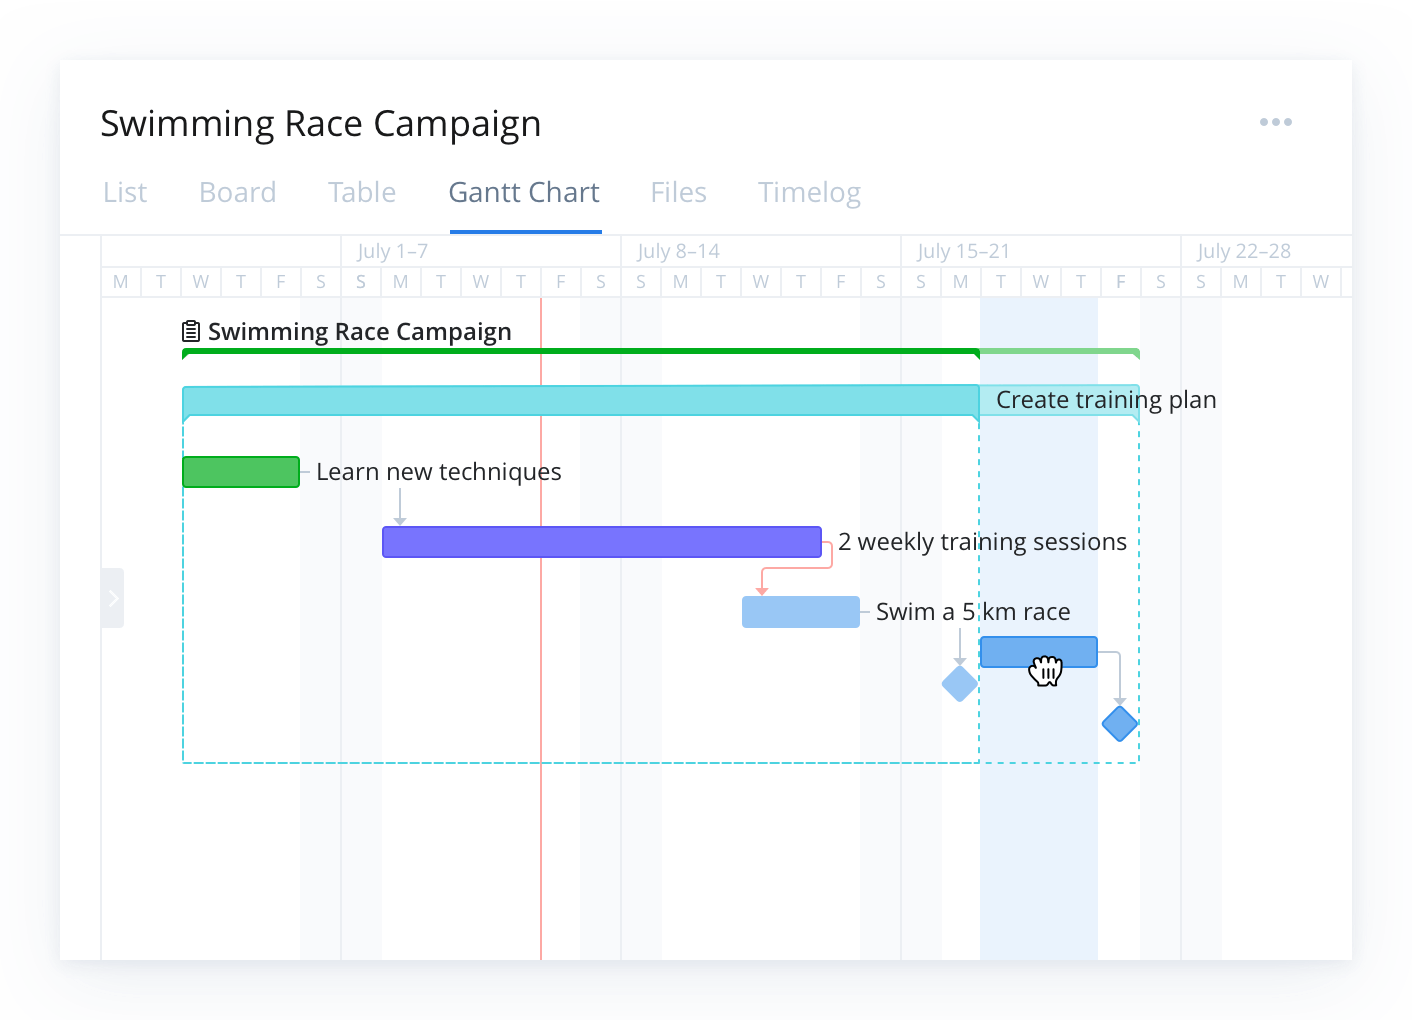
    Ein Gantt-Diagramm ist eine Tabelle, die den Verlauf eines Projekts und alle damit verbundenen Elemente anschaulich darstellt. Dieses Instrument wurde erstmals 1896 von Karol Adamiecki erfunden; Henry Gantt entwickelte im ersten Jahrzehnt des 20. Jahrhunderts seine eigene Version, die einen Projektzeitplan darstellt. Gantt-Diagramme sind ein nützliches Hilfsmittel, um den gesamten Verlauf von einem oder mehreren Projekten abzubilden. Es zeigt Ihnen, welche Aufgaben von anderen abhängig sind und welche Meilensteine anstehen.

    Wrike project management Gantt chart showing tasks and colored timeline bars.

    A Gantt chart can look very different depending on your project methodology — for example, a traditional Waterfall-style Gantt chart lays out tasks in a fixed sequence, while a Gantt chart adapted for Agile methodology may reflect sprints, iterative deliverables, and flexible timelines. Regardless of methodology, the core purpose remains the same: to provide a visual timeline that maps tasks, durations, dependencies, and milestones so teams have a shared schedule and clear visibility into work progress.

    In this guide, you will learn what a Gantt chart is, what it includes, when to use one, and how to build and manage Gantt charts effectively with modern project management tools.

    Key takeaways

    • A Gantt chart is a timeline-based project management tool that visually maps tasks, durations, dependencies, and milestones.
    • It improves planning and coordination by showing how work is sequenced, who is responsible, and where risks or bottlenecks may occur.
    • Key components include task lists, timelines, task bars, progress indicators, and resource assignments.
    • Gantt charts are especially valuable for complex, multi-phase projects that require clear visibility and cross-team alignment.
    • Modern tools like Wrike enhance Gantt charts with real-time updates, automated scheduling, collaboration features, and resource management.

    What is a Gantt chart?

    In project management, a Gantt chart is a graphical schedule that maps project activities against time. Along the left, you see a list of tasks or work packages. Along the top, you see a time scale, such as days, weeks, or months. Each task appears as a bar that stretches from its planned start date to its planned end date.

    A Gantt chart helps you answer questions like:

    • What work needs to be done and in what order?
    • When does each task start and finish?
    • Which tasks depend on others finishing first?
    • Who is responsible for each part of the project?

    By putting all of this in one timeline view, a Gantt chart gives you a single source of truth for planning and tracking your project.

    Why Gantt charts matter in project management

    Gantt charts help project managers:

    • Visualize the entire project schedule at a glance
    • Understand how tasks connect and where dependencies exist
    • Spot potential bottlenecks before they cause delays
    • Communicate timelines clearly to stakeholders
    • Track progress against the plan

    Tools like Wrike enhance these benefits by keeping timelines updated in real time and visible to everyone involved. Unlike simple task lists or calendars, Gantt charts show both the sequence of work and the duration of each task, making them a powerful tool for managing complex initiatives with many moving parts.

    Key components of a Gantt chart

    A Gantt chart with the title “City Hall Project” and 7 horizontal bars with the terms “Business Need”, “High-level Requirements”, “Objectives”, “Project Team”, “Risk Assessment”, “Scope”, and “Success Criteria” listedA Gantt chart with the title “City Hall Project” and 7 horizontal bars with the terms “Business Need”, “High-level Requirements”, “Objectives”, “Project Team”, “Risk Assessment”, “Scope”, and “Success Criteria” listed

    A useful Gantt chart in project management usually includes:

    • Task list
    • Time scale
    • Task bars
    • Dependencies
    • Milestones
    • Progress indicators
    • Owners and resources

    Task list

    A structured list of tasks, subtasks, or work packages that make up the full scope of the project. This list often reflects the work breakdown structure (WBS) and may be grouped into phases, deliverables, or milestones. It forms the backbone of the Gantt chart because every visual element on the timeline corresponds to an item in this list.

    Time scale

    A horizontal calendar running along the top of the Gantt chart. It can display days, weeks, months, or even quarters depending on the length and complexity of your project. The time scale helps you quickly see how long tasks will take and how work stretches across the overall timeline.

    Task bars

    Horizontal bars that visually represent the planned duration of each task. The bar’s placement shows the start and end dates, while its length shows the expected amount of time needed to complete the work. Task bars make it easy to understand the project at a glance without digging into detailed schedules.

    Dependencies

    Arrows or connecting lines showing how tasks relate to each other. For example, one task might need to finish before another can begin (finish-to-start), or two tasks may need to run at the same time. Mapping dependencies helps you understand how delays can affect downstream work and is essential for accurate project planning.

    In modern tools such as Wrike, dependencies automatically adjust when timelines change, helping teams avoid cascading delays.

    Milestones

    Significant points in the project schedule, often marked by diamonds or distinctive symbols. Milestones represent major achievements such as approvals, phase completions, product launches, or client review dates. They act as anchors for measuring progress and ensuring the project stays aligned with critical deadlines.

    Progress indicators

    Visual cues showing how much work has been completed. These may include shaded portions of task bars, percentage-complete labels, or color changes. Progress indicators allow project managers and stakeholders to quickly compare planned timelines against actual performance.

    Owners and resources

    Labels, initials, or icons that identify who is responsible for each task, making accountability clear throughout the project. Some Gantt charts also include resource allocation details such as hours assigned or workload levels. This helps teams avoid overbooking individuals and ensures that tasks are distributed realistically across available resources.

    When to use a Gantt chart

    Gantt charts are especially helpful when:

    • Your project has many tasks, phases, or dependencies
    • You need to coordinate work across multiple teams or functions
    • Stakeholders want a clear visual of timelines and milestones
    • You must manage critical deadlines, such as product launches or campaign dates

    Examples include software releases, marketing campaigns, construction projects, event planning, and cross-functional initiatives. For small, simple efforts, a basic task list may be enough, but as complexity grows, a Gantt chart becomes much more useful. With software like Wrike, teams can scale Gantt charts from simple timelines to complex, cross-functional project plans as needs evolve.

    Who uses Gantt charts?

    Gantt charts are widely used across industries because they make it easier to plan work, manage dependencies, and keep teams aligned. Any team that needs clear timelines and structured project visibility can benefit from them, but they’re especially common in fields where scheduling and coordination are critical.

    Industries that rely heavily on Gantt charts include:

    • Construction and engineering: To sequence tasks, manage contractors, and track milestones for large builds
    • Software development: For mapping releases, tracking dependencies, and coordinating cross-functional teams
    • Marketing and creative teams: To plan campaigns, content calendars, and multi-phase deliverables
    • Manufacturing and product development: To manage production timelines, testing cycles, and launch plans
    • Event management: To coordinate vendors, deadlines, and logistics leading up to event day

    These charts help teams visualize how work moves from start to finish, making them useful for anything from small team projects to enterprise-level initiatives.

    Benefits of Gantt charts for project management

    Gantt charts bring structure, visibility, and predictability to project planning and execution. By laying out tasks across a timeline and showing how work connects, they help teams stay organized and avoid surprises. When supported by modern project management software such as Wrike, these benefits extend beyond planning into day-to-day execution. Key benefits include:

    • Clarity
    • Alignment
    • Risk visibility
    • Better coordination
    • Accountability

    Clarity

    A Gantt chart consolidates all tasks, dates, and milestones into one visual timeline. This makes it easy for teams and stakeholders to understand the project’s overall plan without digging through spreadsheets or documents.

    Alignment

    Because a Gantt chart shows who is responsible for which tasks and when those tasks are scheduled, everyone understands their role in the project. This reduces miscommunication and helps ensure all contributors are working toward the same goals.

    Risk visibility

    Dependencies help teams see where delays might impact other tasks. If one activity starts slipping, the Gantt chart makes it clear which downstream work may also be affected, giving project managers time to adjust before problems escalate.

    Better coordination

    With tasks assigned to individuals or teams along the timeline, Gantt charts simplify resource planning. Teams can spot bottlenecks, identify periods of overload, and adjust assignments to keep work moving smoothly.

    Accountability

    Each task bar shows who owns the work and when it must be completed. This transparency helps reinforce responsibility and keeps the team on track, especially on long or complex projects.

    How teams use Gantt charts in modern project environments

    Gantt charts have been a foundational project management tool for over a century, but today’s digital project environments have transformed how teams use them. 

    Modern work moves faster, involves more stakeholders, and often requires coordinating multiple tools or methodologies. Contemporary Gantt chart software adapts to these needs by offering capabilities that go far beyond basic timelines, including:

    • Real-time progress tracking
    • Automated scheduling updates
    • Resource load balancing
    • Collaboration tools and shared visibility
    • Integration with Agile or hybrid workflows

    Real-time progress tracking

    Modern Gantt charts update instantly as tasks are completed or adjusted. This helps teams spot delays early, understand how changes affect the broader schedule, and maintain an accurate project view without manual updates.

    Automated scheduling updates

    When one task shifts, connected dependencies automatically adjust. This reduces guesswork, eliminates outdated timelines, and prevents scheduling conflicts — all benefits that are especially useful in complex or multi-phase projects.

    Resource load balancing

    Contemporary tools allow project managers to see resource availability directly on the timeline. This helps prevent over-allocation, identify gaps, and ensure work is assigned realistically based on team capacity.

    Collaboration tools and shared visibility

    Where early Gantt charts were static, modern versions support comments, file attachments, and shared access. Cross-functional teams can communicate in context, track updates, and keep stakeholders aligned without the need for endless meetings or email threads.

    Integration with Agile or hybrid workflows

    Gantt charts are no longer just for traditional Waterfall projects. Many teams blend them with Agile methods, using timeline views alongside Kanban boards, sprint planning tools, and backlog management. This hybrid approach provides both flexibility and long-range visibility.

    Experience better project clarity with Wrike

    A well-built Gantt chart gives teams the structure, visibility, and confidence they need to deliver projects on time. With Wrike’s dynamic Gantt chart view, automated scheduling updates, real-time collaboration tools, and resource management features, you can move from static timelines to a truly connected project workflow. Whether you’re coordinating simple tasks or managing complex cross-team initiatives, Wrike makes planning clearer, execution smoother, and adaptability effortless.

    Start your free trial today and see how Wrike transforms Gantt charts into a powerful engine for project success.

    Was ist also ein Gantt-Diagramm im Projektmanagement? Einfach ausgedrückt handelt es sich um eine Zeitleisten-Ansicht aller kommenden Aufgaben und Termine.

    Zur weiteren Lektüre:

    • Projektmanagement-Grundlagen: Gantt-Diagramme – Leitfaden für Anfänger


    Erweiterte Begriffe 5 Fragen
    Was bedeutet Change Management im Projektmanagement? Was bedeutet Kostenkontrolle im Projektmanagement? Was ist ein Gantt-Diagramm im Projektmanagement? Wofür steht PERT im Projektmanagement? Was ist ein Projektzeitplan im Projektmanagement?
    • Produkt
      • Produkt-Tour
      • Preise
      • Vorlagen
      • Apps & Integrationen
      • Aufgabenverwaltung
      • Gantt-Diagramme
      • Wrike-Status
      • Sicherheit
      • Wrike API
      • Funktionen
    • Lösungen
      • Enterprise
      • Marketing
      • Kreativ
      • Projektmanagement
      • Produktentwicklung
      • Business Operations
      • Fachdienstleistungen
      • Studenten
      • Alle Teams
    • Materialien
      • Hilfe-Center
      • Community (auf Englisch)
      • Blog
      • Webinare
      • Interaktive Schulung
      • Support
      • Google Projektmanagement-Tools
      • CCPA Vertraulichkeitshinweis
    • Unternehmen
      • Über uns
      • Karriere
      • Unsere Kunden
      • Veranstaltungen
      • Pressemappe
      • Partner Programm
      • Nutzerkonferenz
      • Kontaktieren Sie uns
    • Leitfäden
      • Projektmanagement-Leitfaden
      • Leitfaden für Fachdienstleistungen
      • Kanban-Leitfaden (EN)
      • Agile-Leitfaden (EN)
      • Scrum-Leitfaden
      • Leitfaden zum Projektmanagement im Marketing (EN)
      • Leitfaden Kollaboratives Arbeitsmanagement
      • Leitfaden Digitales Marketing
      • Leitfaden Markteinführung (EN)
      • Homeoffice-Guide
      • Leitfaden zur Rückkehr an den Arbeitsplatz (EN)
      • Leitfaden Projektmanagement (EN)

    Wrike Nachrichten und Aktualisierungen abonnieren

    Abonnieren Sie unsere Marketing-E-Mails und bleiben Sie mit unseren neuesten Nachrichten und Aktualisierungen auf dem Laufenden.

    Logo AICPALogo BSILogo CSA STAR

    Sicherheit auf Enterprise-Niveau.
    Verfügbarkeit von über 99,9 %

    ©2006-2026 Wrike, Inc. Alle Rechte vorbehalten. Patentiert. Datenschutzerklärung. Nutzungsbedingungen. Cookie-Einstellungen. Ihre Datenschutzoptionen

    Wrike logo